

John Bajkowski
is the president of AAII.
 BSET
CLAR
CMT
ESCA
FRD
HOFT
HURC
KTCC
MG
NAESX
NC
PANL
RCKY
STRT
TITN
VFINX
VPG
BSET
CLAR
CMT
ESCA
FRD
HOFT
HURC
KTCC
MG
NAESX
NC
PANL
RCKY
STRT
TITN
VFINX
VPG
The Model Shadow Stock Portfolio declined 7.8% during December, pulling down its full-year 2022 return to a loss of 19.7%. It is the ninth time that the Model Shadow Stock Portfolio had a losing year over its 30-year history. The year 2022 also marked the 13th time that the Model Shadow Stock Portfolio has lagged the S&P 500 index for a calendar year, as measured by the Vanguard 500 Index fund  (VFINX). The S&P 500 lost 5.8% during December, contributing to its 18.2% loss during 2022.
The relative performance of small-cap stocks to large-cap stocks often runs in streaks. Small-company stocks have outperformed large-company stocks over the long term, but they certainly do not best large-cap stocks every year, and they tend to exhibit flashes of outperformance followed by periods underperformance.
Over its 30-year existence, the Model Shadow Stock Portfolio outperformed the Vanguard 500 Index fund in 17 of the 30 calendar years, or 57%.
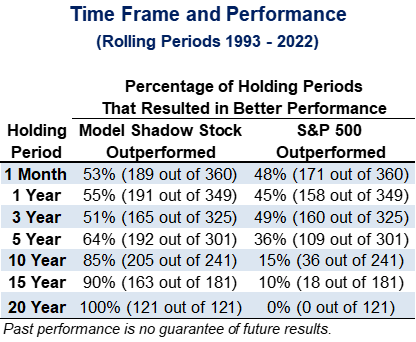
Since calendar years are somewhat arbitrary start and end dates, rolling periods are often used to smooth out seasonality. There have been 349 rolling 12-month time periods over the last 30 years. The Model Shadow Stock Portfolio has outperformed the Vanguard 500 Index fund in 55% of the one-year periods. When it comes to three-year holding periods, the Model Shadow Stock Portfolio has outperformed the Vanguard 500 Index fund in 51% of the periods, while outperforming the Vanguard 500 Index fund in 64% of the five-year rolling periods and in 85% of the rolling 10-year periods over last 30 years. The S&P 500 has outperformed the Model Shadow Stock Portfolio in 18 out of the 181 15-year holding periods, but not in any of the 121 20-year holding periods.
It is important to consider that a historical pattern may not repeat itself in the future, but longer holding periods normally provide a greater likelihood that stocks exhibit their potential for positive returns. A very practical way to view investor risk is to examine the likelihood that your invested money will diminish from the time of the initial investment to the end of the holding period time frame and to keep in mind that the variability of expected annual returns is reduced with longer holding periods.

The table here assumes an investment in the Model Shadow Stock Portfolio or the Vanguard 500 Index fund that remains invested for the holding period indicated. The table indicates the percentage of times the portfolio would have suffered a loss from 1993 through 2022. It also includes the greatest compound annual gain and loss observed for the various holding periods.
The table helps to reinforce the important lesson that the impact of the large variability in short-term stock market returns is reduced with longer holding periods. The Model Shadow Stock Portfolio gained as much as 203.5% during one 12-month holding period (April 2020 through March 2021), but it has also lost more than half its value during a 12-month holding period (55.6% loss from March 2008 through February 2009). Stocks offer the potential for greater returns over the long term compared to safer holdings such as Treasury bills, but you must have a longer time horizon to help realize the potential. The variability of returns—risk as measured by the chance of loss—goes down as the holding period gets longer.

The table here displays the annual returns for the S&P 500 select sectors, ranked by their 2022 performance. We have color coded the returns for each year so that the best-performing groups are bright green while the weakest groups are a vibrant red. The color scaling allows you to more easily see how fortunes of the sectors have flipped from year to year.
The energy and utilities sectors were the only two sectors to post positive gains during 2022. The energy sector has been the top-performing sector for two straight years—gaining 64.6% during 2022 and 53.4% in 2021. Demand from a post-pandemic rebounding global economy drove up oil prices during 2021, but during 2022 energy disruption was largely driven by Russia’s invasion of Ukraine.
The utilities sector gained 1.6% during 2022. The utilities sector is generally a defensive group that holds up better than cyclical stocks during market downturns. While its 17.7% gain during 2021 is historically strong, it was the third-weakest-performing sector in the hot 2021 market environment, during which the S&P 500 gained 28.7%. The defensive sectors lagged during the rebounding environment of 2021, but shone during 2022 as investors started to consider the greater likelihood of a recession.
Other defensive sectors such as consumer staples (down 0.7%) and health care (down 2.0%) were also among the best-performing sectors during 2022. In contrast, companies providing discretionary goods and services, which can be deferred during poor economic conditions, were among the weakest sectors in 2022. Technology (down 27.6%) and communication services (down 37.7%) shone during the previous bull market and pandemic period. However, their rich valuations finally caught up with them during 2022. Consumer discretionary was the second-worst-performing sector during 2022 with a 36.2% loss.
The table of sector returns highlights how sector performance can vary significantly from year to year depending on the economic environment. The market is forward-looking, anticipating changes and pricing (or discounting, as they say on TV) their future expectations in stock prices today. Big market moves come when those best guesses turn out to be wrong or when something completely unexpected occurs. For example, we were not discussing the potential of a drawn-out war between Russia and Ukraine at the start of 2022, yet it was one of the major global disruptors last year and its resolution is far from clear. Company quarterly earnings announcements are important events because they help to confirm or change the market’s viewpoint of the company, its industry and the economy as whole.
The expectation of inflation being a transient byproduct of the disruption from the pandemic was proven wrong in 2022, leading the Federal Reserve to begin raising interest rates in order to slow the economy. The sudden and dramatic rise in interest rates put a brake on many sectors such as real estate. Real estate was the second-best-performing sector during 2021 with a 46.2% gain, only to see its fortunes fall during 2022 with 26.1% loss as residential real estate activity suddenly slowed down. Many individuals are now priced out of the housing market, with mortgage rates at levels not seen for 20 years, and many households not able to give up their low-interest-rate mortgages to switch homes. This household formation has a critical multiplier effect on the economy, which impacts discretionary spending of consumers and industrial production and transportation of goods, etc. The multiplier impact is also true of high-cost discretionary purchases such as autos, which are suddenly seeing a softening of demand.
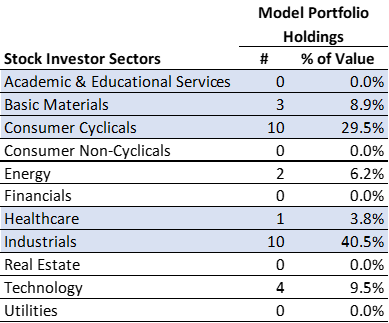
The Model Shadow Stock Portfolio uses a bottom-up quantitative approach to making stock additions and deletions. Financials and utilities are excluded from consideration. Financials are excluded because their balance sheet assets and liabilities are not well suited to analysis using the price-to-book-value (P/B) ratio. The sector makeup of the Model Shadow Stock Portfolio is not actively managed, yet it does impact the portfolio’s performance. The table below indicates the current composition of the portfolio using the sector designations provided by Refinitiv and used in AAII’s Stock Investor Pro fundamental stock screening and research database. The portfolio is currently very heavily weighted toward industrials and consumer cyclicals (discretionary).

In the realm of size and value, the leading size segment was mid-cap stocks and the value style generally held up better than growth-oriented stocks during 2022. As displayed in the table here, this marks the greatest annual size-style leadership shift since 2016.
Within the S&P indexes, the large-cap S&P 500 lost 18.1% during 2022, while the S&P MidCap 400 index lost 13.1% and the S&P SmallCap 600 index lost 16.1% during 2022.
Looking at the large-cap segment, growth stocks were down 29.4% for the year, after losing 7.6% during December. Large-cap value stocks were down 5.2% for 2022, after losing 3.9% during December.
In the mid-cap segment, growth stocks were down 19.0% for the year, after losing 6.0% during December. Mid-cap value stocks were down 6.9% for 2022, after losing 5.1% during December.
Small-cap growth stocks were down 21.1% during 2022, after losing 6.9% during the December. Small-cap value stocks were down 11.0% during 2022 after losing 6.5% during December.
Since its inception in 1993, the AAII Model Shadow Stock Portfolio has a compound annual average return of 13.5% versus the Vanguard 500 Index fund’s gain of 9.5% per year on average over the same period, and the Vanguard Small Cap Index fund’s (NAESX) average annual gain of 9.5%.
Twenty-eight stocks met the initial selection criteria for the Model Shadow Stock Portfolio as of January 9, 2023, down from 30 passing stocks one month ago. AAII members can see and research which companies are currently passing the initial selection criteria in the Shadow Stock Ideas table on AAII.com. The list of new Shadow Stock Ideas is updated daily—Tuesday through Saturday.
Of the 28 qualifying companies, 13 are currently held in the Model Shadow Stock tracking portfolio: Bassett Furniture Industries Inc. (BSET), Big 5 Sporting Goods Corp. (BGFV), Container Store Group Inc. (TCS), Fonar Corp. (FONR), Friedman Industries Inc. (FRD), Hooker Furnishings Corp. (HOFT), Hurco Companies Inc. (HURC), Key Tronic Corp. (KTCC), Lazydays Holdings Inc. (LAZY), Mistras Group Inc. (MG), NACCO Industries Inc. (NC), Pangaea Logistics Solutions Ltd. (PANL) and Strattec Security Corp. (STRT). Qualifying companies are those held in the Model Shadow Stock Portfolio that currently meet the initial purchase rules. (They are designated as “currently qualifies” in the notes column of the Model Shadow Stock Portfolio table on AAII.com. However, if you go online, the notes may not match the list discussed here since the notes on the website table are dynamically updated daily.)

Clarus Corp. (CLAR) came off the qualifying list when its market capitalization went above $300 million. Core Molding Technologies Inc. (CMT), Escalade Inc. (ESCA) and Rocky Brands Inc. (RCKY) saw their price-to-book ratios go above 0.90. NACCO Industries started to qualify again when its market cap moved below $300 million. NACCO Industries last passed during our review on September 9, 2022.
As of January 9, 2023, Vishay Precision Group Inc. (VPG) had the highest price-to-book-value ratio in the Model Shadow Stock Portfolio. Its ratio of 1.93 is above the 0.90 maximum value used for initially qualifying a stock for inclusion to the portfolio. However, stocks are not removed from the portfolio until their price-to-book ratio rises to three times the initial maximum value (2.70).
Titan Machinery Inc. (TITN) had the highest market cap in the portfolio, with a value of $938.7 million as of January 9, 2023. The Model Shadow Stock Portfolio looks for stocks with a market cap (share price times shares outstanding) greater than $30 million but less than $300 million when adding stocks to the portfolio. Shadow stocks with a market cap three times the initial market-cap maximum ($300 million × 3 = $900 million) at the time of a quarterly review are removed from the portfolio, assuming there is a suitable replacement.
Click here to see the current purchase and sell rules for the portfolio.
The next quarterly review of the AAII Model Shadow Stock Portfolio will take place around the beginning of March 2023, after most of the holdings have announced their quarterly earnings. Any changes to the portfolio will be announced at the time they are made in a special Model Shadow Stock Portfolio Update email (sign up at www.aaii.com/email).
The final table here shows the 2022 performance of all of the holdings within the Model Shadow Stock Portfolio during the year. If you see a value of zero at the start of the year, it indicates that the stock was added to the portfolio after the start of the year, while an ending value of zero indicates that the holding was sold before the end of the year. We ended the year with 30 holdings but held 39 stocks over the course of 2022. The turnover ratio was 33% in 2022, which translates into average holding period of 3 years. The turnover ratio was a little higher than the long-term average of 25%, which equates to a four-year average holding period. Note that the turnover ratio is calculated by dollar value of purchases and sales and how they relate to the average portfolio value.
Transportation and energy stocks were the best-performing stocks during 2022, while consumer-focused discretionary stocks had the weakest performance in 2022. The profit and return on investment (ROI) columns both consider the impact of cash dividend distributions during the year.
Bassett Furniture Industries, Incorporated (BSET)
(01/12/2023)
Bassett Furniture Industries declared a regular quarterly dividend of $0.16 per share of common stock, payable on February 24. The stock will trade ex-dividend on Thursday, February 9.
(12/19/2022)
Ennis reported third-quarter 2022 earnings per share of $0.44, which increased year over year from $0.29 per share. Net sales of $110.2 million increased by 7.1% over the same period.
For the third quarter, the company’s gross margin was 30.4% and operating margin was 14.7%, compared to a gross margin of 28.4% and an operating margin of 11.3% in the same period of fiscal-year 2021.
Chairman, CEO and president Keith Walters commented, “We are pleased with our performance for the third quarter. For the seventh consecutive quarter, revenues and operating income improved on a year-over-year basis due to continued strong customer demand for our products and our disciplined cost management and pricing strategies.”
Ennis also declared a quarterly cash dividend of $0.25 per share on the company’s common stock. The dividend is payable on February 2, 2023, to shareholders of record as of January 5, 2023.
(01/06/2023)
Hurco Companies reported fourth-quarter 2022 earnings of $0.22 per share, which decreased year over year from $0.31 per share. Net sales of $63.4 million decreased by 8.0% over the same period. For the quarter, the company’s operating margin was 4.3%, compared to an operating margin of 4.5% in the same period of fiscal 2022.
Kimball Electronics, Inc. (KE)
(01/10/2023)
Kimball Electronics announced that chairman and CEO Donald D. Charron will retire on February 28, 2023. Richard D. Phillips, most recently president and CEO at Elkay Manufacturing Co., will join Kimball Electronics on March 1, 2023, as CEO and a director. Lead independent director Robert J. Phillippy, a member of Kimball Electronics’ board since 2018, will become the company’s non-executive chairperson.
VOXX International Corporation (VOXX)
(01/09/2023)
VOXX International reported third-quarter fiscal-2023 diluted earnings per share of $0.30, surpassing the I/B/E/S consensus estimate of $0.105 per share by $0.195, or 185.7%. This increased from a net loss per diluted share of $1.158 in the same quarter one year ago. Net sales totaled $143.1 million, a 25.4% decrease over the comparable period of fiscal 2022. The variance primarily relates to an interim arbitration award expense of $39.4 million related to the Seaguard arbitration incurred in the prior year.
(01/09/2023)
VSE Corp. announced a regular quarterly cash dividend of $0.10 per share of common stock. The dividend is payable on February 9, to stockholders of record at the close of business on January 26. The stock will trade ex-dividend on Wednesday, January 25.
 Get updates about the portfolio that has outperformed the market by 211.9%
since inception!
Get updates about the portfolio that has outperformed the market by 211.9%
since inception!