

John Bajkowski
is the president of AAII.
 AP
BSET
BZH
CVLG
DFSCX
EBF
FRD
HOFT
HURC
KTCC
MG
NAESX
NC
PANL
RCKY
STRT
TITN
VFINX
VPG
AP
BSET
BZH
CVLG
DFSCX
EBF
FRD
HOFT
HURC
KTCC
MG
NAESX
NC
PANL
RCKY
STRT
TITN
VFINX
VPG
AAII has a long history of illustrating how to apply quantitative stock screens or filters to the universe of small-company stocks to identify interesting candidates. The Model Shadow Stock Portfolio is one such example that applies value, profitability, sector and liquidity filters to a micro-cap stock universe. This is done so there is greater potential to find mispriced gems among these less analyzed and tracked companies. There is strong evidence that small stocks have provided greater returns for the individual investor with a long-term horizon and who is willing to put up with greater volatility.
There are many ways to measure company size—revenue, assets, employee count, market capitalization, enterprise value, etc. Most studies of relative performance by size, however, focus on market cap. Market cap is simply calculated by multiplying the number of shares a company has issued by the share price. It represents the market’s consensus of a company’s value. The largest companies have a market cap of over $2 trillion, while smaller companies have a market cap of $1 billion or less.
The most common way is to simply arrange the companies from smallest to largest and segment them into bands of equal size—typically bands holding 10% (declines) of the companies. These decile breakpoints are determined by examining domestic companies listed on the New York Stock Exchange (NYSE) and then applying the size and value breakpoints for stocks listed on all domestic exchanges.
 The table here lists the historical performance of the decile groups along with some of their characteristics, updated with data through year-end 2022.
It might be helpful to review some of the data elements in the chart. The annual return is the compound annual return (geometric return) that was realized over these time periods. It assumes that you are reinvesting any gains or income. The return above decile 1 column relates the compound return for a given decile group against the largest decile group (group 1). Generally, the smaller the decile group, the greater the compound annual return.
The average return is the average (mean) of the individual annual returns. It is higher than the compound annual return because simply averaging the annual returns does not correctly take into account the impact of losing money in a given year. For example, if you are down 50% one year and then up 50% the next year, the simple average is 0.0%. But you are still down 25% from your original starting point. The compound annual return over that two-year period is –13.4%. To get to your starting point after a 50% decline one year, you would need a 100% increase the next year. The average return is in the table to help with calculations involving the standard deviation.
The standard deviation shows the level of dispersion in relationship to the mean or simple average return. The larger the standard deviation, the greater the highs and lows. We see that as the decile bands go from the largest size group to the smallest, the standard deviation or volatility increases.
The number of companies notes how many companies fall into each decile. The number of companies vary by decile because the market-cap decile bands are decided among the companies listed on the NYSE. Those market-cap breakpoints are then used to determine where to place companies listed on the American Stock Exchange (AMEX) and the Nasdaq Stock Exchange. A number of larger Nasdaq-listed companies make it into higher decile groupings, but the numbers show that as you add in the other exchanges you are in turn adding more small companies.
The largest stock column notes the market cap of largest company within a given segment. With the significant market decline last year, we saw the market cap of the largest stock decline for most of the groups. For example, the market cap for the largest company in ninth decile was $373.9 million at the end of 2022, down from $627.8 million at the end of 2021.
The percent of total market cap column sums up the market cap of all the stocks in a given decile and relates that market cap to the sum of the market cap of all the companies at the end of year. In contrast, the percent of total companies column sums up the number of companies in a given decile group and relates that to the total number of companies. You can see the concentration of money invested in the largest company even though that represents only a small segment of the public companies in the U.S.
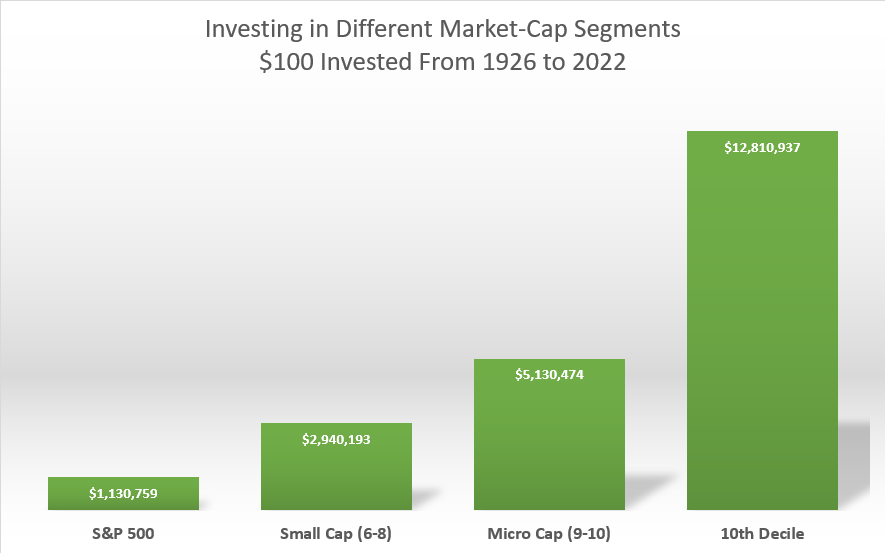
As shown in the table above, between 1926 and the end of 2022, the smallest companies (10th decile) have, on average, generated an annual return of 12.9% over that period. By comparison, the companies in the S&P 500 index—the 500 largest companies traded on U.S. exchanges based on market cap—generated an average annual return of 10.1% over the same period. So, if you invested $100 in these 10th-decile stocks at the beginning of 1926, your investment would have grown to $12,810,937 at the end of 2022, compared to only $1,130,759 if you had invested the same $100 in the S&P 500 over that period.
The investment community today uses the term “small cap” to describe companies up to a market cap of $3 billion. The Russell 2000 index—considered by many to be a comprehensive index of small-cap stocks—has a dollar-weighted market cap of $2.95 billion, although its median, or midpoint, market cap is $1.07 billion. However, as of the end of 2022, the index’s largest constituent had a market cap of $10.52 billion, definitely not what most would consider a small-cap stock.
The S&P SmallCap 600 index, another popular small-cap index, had an average market cap of $1.73 billion as the end of 2022, and a median market cap of $1.47 billion. The range of market caps for its constituents was $248 million to $6.61 billion.
However, the original research on small-cap stocks was done on the smallest 20% of stocks ranked by market cap on the NYSE. Subsequent research continued to use NYSE stocks to determine market-cap ranges but did not require that stocks be traded on the NYSE. That lowest 20% (ninth and 10th deciles) is still the market-cap range used by academic researchers today when examining the “small-cap effect.” At current market valuations, this would include stocks with market caps of up to only $373.9 million, too small for most mutual funds to invest in.
 As a result of this divergence between the academic and real-world definitions of the term small cap, stocks in the smallest range today are termed micro caps.
As the table shows, though, the impact of investing in the small-cap segment versus the micro-cap segment isn’t merely a matter of semantics. Between 1926 and the end of 2022, investing in small-cap stocks—those in the sixth, seventh and eighth deciles—generated an average annual return of 11.2%. Investing in only stocks in the 10th decile—the smallest 10% of stocks—generated an average annual return of 12.9%. That difference resulted in over $9.87 million more wealth over the period on a $100 investment.
As we often noted, the relative performance of small-cap stocks to large-cap stocks often runs in streaks. Small-company stocks have outperformed large-company stocks over the long term, but they certainly do not best large-cap stocks every year, and they tend to exhibit flashes of outperformance followed by periods underperformance. The other cost you pay for the potential of higher returns is greater volatility. Just as the observed historical returns of stock decile groupings went up as the companies got smaller, so did their standard deviation. To succeed with smaller companies, you must be willing to put up with greater declines and longer streaks of underperformance.
The stock market bounced back strongly in January, after a year that most investors would rather forget. The Model Shadow Stock Portfolio gained 13.9% during January while the S&P 500 index as measured by the performance the Vanguard 500 Index fund  (VFINX) was up 6.3%. The Vanguard Small Cap Index fund (NAESX) was up 10.1%, while the DFA U.S. Micro Cap fund (DFSCX) gained 8.7% during January.
Value stocks generally outperformed growth stocks during January, except in the small-cap segment.
In the large-cap segment, growth stocks were up 5.6% during January, compared to an 18.6% loss over the last 12 months. Large-cap value stocks were up 7.0% during January and are now up 3.0% over the last 12 months.
In the mid-cap segment, growth stocks are down 3.2% over the last 12 months, after gaining 7.1% during January. Mid-cap value stocks are up 7.9% over the last 12 months, after gaining 11.4% during the month.
Small-cap growth stocks are down 6.5% over the last 12 months, while small-cap value stocks are down 0.5%. Small-cap growth stocks gained 9.9% during January, while small-cap value stocks gained 9.5% during the month.
Since its inception in 1993, the AAII Model Shadow Stock Portfolio has a compound annual average return of 14.0% versus the Vanguard 500 Index fund’s gain of 9.7% per year on average over the same period. Over the same period, the Vanguard Small Cap Index fund posted an average annual gain of 9.9%.
Within the Model Shadow Stock Portfolio, the best-performing stocks in January were Rocky Brands Inc. (RCKY), up 33.3%; Ampco-Pittsburgh Corp. (AP), up 30.7%; and Beazer Homes USA Inc. (BZH), up 28.3%. The weakest-performing stocks for the month were Ennis Inc. (EBF), down 4.2%; Covenant Logistics Group Inc. (CVLG), down 4.1%; and SigmaTron International Inc. (SGMA), down 2.1%. They were also the only stocks in the portfolio that posted losses during the month.
Any noteworthy news on the Model Shadow Stock Portfolio holdings is below. We have also started to archive news items on the holdings. The archives can be accessed from news column of the Model Shadow Stock Portfolio tab of the Shadow Stock website.
Twenty-six stocks met the initial selection criteria for the Model Shadow Stock Portfolio as of February 14, 2023, down from 28 passing stocks one month ago. AAII members can see and research which companies are currently passing the initial selection criteria in the Shadow Stock Ideas table on AAII.com. The list of new Shadow Stock Ideas is updated daily—Tuesday through Saturday.
Of the 26 qualifying companies, 10 are currently held in the Model Shadow Stock Portfolio: Bassett Furniture Industries Inc. (BSET), Big 5 Sporting Goods Corp. (BGFV), Container Store Group Inc. (TCS), Fonar Corp. (FONR), Friedman Industries Inc. (FRD), Hurco Companies Inc. (HURC), Key Tronic Corp. (KTCC), Lazydays Holdings Inc. (LAZY), Mistras Group Inc. (MG) and NACCO Industries Inc. (NC). Qualifying companies are those held in the Model Shadow Stock Portfolio that currently meet the initial purchase rules. (They are designated as “currently qualifies” in the notes column of the Model Shadow Stock Portfolio table on AAII.com. However, if you go online, the notes may not match the list discussed here since the notes on the website table are dynamically updated daily.)
Hooker Furnishings Corp. (HOFT) and Pangaea Logistics Solutions Ltd. (PANL) came off the qualifying list when their price-to-book-value (P/B) ratios went above 0.90. Strattec Security Corp. (STRT) came off the qualifying list after it reported a loss for the latest quarter. The normalized quarterly loss of $0.47 per share was not enough push the trailing 12-month earnings into the red, so the stock will not go on probation. The stock is up by double digits this month.
As of February 14, 2023, Vishay Precision Group Inc. (VPG) had the highest price-to-book ratio in the Model Shadow Stock Portfolio. Its ratio of 2.06 is above the 0.90 maximum value used for initially qualifying a stock for inclusion in the portfolio. However, stocks are not removed from the portfolio until their price-to-book ratio rises to three times the initial maximum value (2.70).
Titan Machinery Inc. (TITN) had the highest market cap in the portfolio, with a value of $1.006 billion as of February 14, 2023. The Model Shadow Stock Portfolio looks for stocks with a market cap (share price times shares outstanding) greater than $30 million but less than $300 million when adding stocks to the portfolio. Shadow stocks with a market cap three times the initial market-cap maximum ($300 million × 3 = $900 million) at the time of a quarterly review are removed from the portfolio, assuming there is a suitable replacement.
Click here to see the current purchase and sell rules for the portfolio.
The next quarterly review of the AAII Model Shadow Stock Portfolio will take place around the beginning of March 2023, after most of the holdings have announced their quarterly earnings. Any changes to the portfolio will be announced at the time they are made in a special Model Shadow Stock Portfolio Update email (sign up at www.aaii.com/email).
(02/01/2023)
Advanced Emissions Solutions announced the closure of a previously announced agreement with Arq Ltd. to combine their respective businesses and structure.
The company issued a combination of shares of common stock and shares of a newly created series of preferred stock in exchange for all the equity interests in all of Arq’s subsidiaries. The new preferred shares will automatically convert to common stock upon the approval by Advanced Emissions Solutions’ shareholders. Until conversion, the preferred security will accrue dividends at an 8% coupon rate (or, if greater, the dividend paid on Advanced Emissions Solutions common shares) payable in cash or in kind. The coupon will increase at set intervals if the conversion is not approved within 635 days of closing.
The company also closed on a private placement of approximately $15.4 million of its common stock from certain significant Arq shareholders and members of Arq management at a price of $4.00 per share and a $10.0 million term debt facility.
Bassett Furniture Industries, Incorporated (BSET)
(01/24/2023)
Bassett Furniture Industries announced the results of its fourth quarter and fiscal-year 2022. The company reported diluted earnings for the quarter of $0.55 per share, beating the I/B/E/S consensus estimate of $0.375 per share by 46.7%. Full-year diluted earnings totaled $6.96 per share, compared to $1.83 per diluted share one year ago.
On a full-year basis, total sales of $485.6 million increased 12.7% over the comparable period of 2021, up from $430.9 million. Operating income increased 43.6% to $34.9 million from $24.3 million one year ago. Net income of $65.3 million for the year increased over 260%, up from $18.0 million one year ago.
(02/01/2023)
Beazer Homes announced the results of its first fiscal quarter of 2023. Net income from continuing operations was $24.4 million, or $0.80 per diluted share, compared to $34.9 million, or $1.14 per diluted share, one year ago.
Homebuilding revenue of $444.1 million was down 0.6% on an 18.3% decrease in home closings, partially offset by a 21.6% increase in average selling price. The company saw an increase in cancelations to 37.1% versus 11.8% a year ago. Backlog dollar value of $940.9 million was down 33.0% on a 40.2% decrease in backlog units to 1,740, partially offset by a 11.9% increase in average selling price of homes in backlog.
Covenant Logistics Group, Inc. (CVLG)
(02/16/2023)
Covenant Logistics Group declared a quarterly dividend of $0.11 per share on its Class A and Class B common stock, an increase of $0.08 per share. The dividend is payable on March 31 to shareholders of record on March 3.
(01/25/2023)
Covenant Logistics Group announced the results of its fourth quarter and fiscal-year 2022. The company reported adjusted diluted earnings per share for the quarter of $1.37, missing the I/B/E/S consensus estimate of $1.42 per share by 3.2%. Full-year adjusted diluted earnings per share are $5.84, an increase from $3.61 per share in 2021.
On a full-year basis, total sales of $1.2 billion increased 16.3% over the comparable period of 2021, up from $1.04 billion. Operating income increased 79.7% to $120.6 million from $67.2 million a year ago. Net income of $108.7 million for the year increased 78.9%, up from $60.7 million a year ago.
(02/16/2023)
Ducommun announced fourth-quarter and full-year 2022 results. Fourth-quarter earnings per diluted share were $0.65, missing the I/B/E/S consensus estimate of $0.85 per share by 30.7%. The company saw a large earnings decrease in the fourth quarter, attributable to the gain on sale-leaseback of a facility in the fourth quarter of 2021. Adjusted earnings per diluted share totaled $0.85, in line with the I/B/E/S consensus estimate.
Sales and gross profit for the quarter both increased over the prior-year period, up 14.2% and 3.6%, respectively. Operating income decreased by 18.0%. Adjusted net income of $10.5 million for the quarter was relatively flat year over year.
(02/14/2023)
Fonar reported second-quarter 2023 earnings results. The company reported earnings per diluted share of $0.32, a 78.1% decrease from $0.57 per diluted share in the prior-year period. Net income of $2.01 billion for the quarter was down 80.1% from $3.78 billion year over year.
Friedman Industries, Incorporated (FRD)
(02/09/2023)
Friedman Industries reported third-quarter 2023 earnings per share of $0.19, which increased year over year from a loss of $0.45 per share. Net sales of $111.9 million increased by 116.5% over the same period a year ago. For the third quarter, the company’s operating margin was 1.6%, compared to an operating margin of –7.6% in the same period of fiscal-year 2021.
“We appear to have shifted from a declining price environment to an increasing price environment during the 2022 quarter,” said president and CEO Michael J. Taylor. “An emphasis on inventory management, price risk management and close relationships with customers and suppliers helped us navigate a very challenging period with HRC [hot-rolled coil] price falling approximately 60% from April 2022 to December 2022.”
(02/09/2023)
Global Ship Lease declared a dividend of $0.375 per share for the fourth quarter of 2022, payable on March 6 to shareholders of record as of February 22. The stock will trade ex-dividend on Tuesday, February 21.
(01/31/2023)
Key Tronic reported second-quarter 2023 earnings per share of $0.09, which increased year over year from $0.05 per share. Net sales of $123.7 million decreased 8.0% over the same period. For the second quarter, the company’s gross margin was 7.2% and the operating margin was 2.9%, compared to a gross margin of 7.3% and operating margin of 1.2% in the same period of fiscal-year 2022.
For the third fiscal quarter of 2023, Key Tronic expects revenue in the range of $160 million to $170 million and earnings in the range of $0.15 to $0.25 per share.
Kimball Electronics, Inc. (KE)
(02/06/2023)
Kimball Electronics reported second-quarter 2023 earnings per share of $0.43, which increased year over year from $0.20 per share. Net sales of $436.7 million increased by 38.5% over the same period a year ago. For the second quarter, the company’s operating margin was 4.0%, compared to an operating margin of –2.2% in the same period of fiscal-year 2022. As part of the announcement, Kimball Electronics raised its guidance for net sales in fiscal 2023 to a range of $1.7 billion to $1.8 billion, an increase of 26% to 33% compared to the prior year.
(02/08/2023)
Mistras Group announced that senior executive vice president and chief operating officer (COO) Jonathan Wolk will be departing the company effective immediately. In the interim, president and CEO Dennis Bertolotti will assume Wolk’s duties.
(02/13/2023)
Rocky Brands declared a quarterly cash dividend of $0.155 per share, payable on March 15 to all shareholders of record as of the close of business on March 1. The stock will trade ex-dividend on Tuesday, February 28.
Strattec Security Corporation (STRT)
(02/01/2023)
Strattec Security reported financial results for the second fiscal quarter of 2023, ended January 1, 2023. The company reported a diluted loss per share of $0.47 compared to earnings of $0.87 per share in the second quarter of 2021. Net sales for the quarter were $113.2 million, compared to net sales of $112.9 million a year ago. Strattec Security reported a net loss of $1.8 million in the quarter, compared to net income of $3.4 million in the comparable period one year ago.
The Container Store Group, Inc. (TCS)
(02/07/2023)
Container Store Group announced the financial results of third-quarter 2022. The company reported earnings per diluted share of $0.08, missing the I/B/E/S consensus estimate of $0.123 per share by 35%. Net income for the quarter totaled $4.2 billion, down from the $13.7 billion reported in the comparable quarter of 2021. Gross margin of 56.9% was relatively the same as for the third quarter of 2021. Operating margin decreased from 8.3% to 4.2% year over year. Net profit margin was also significantly depressed at 1.7% for the current quarter, compared to 5.1% in the comparable quarter of 2021.
Vishay Precision Group, Inc. (VPG)
(02/14/2023)
Vishay Precision Group announced fourth-quarter 2022 earnings per share of $0.76, beating the I/B/E/S consensus estimate of $0.62 per share by 25.4%. Gross profit margin, operating profit margin and net profit margin increased across the board. Total revenue for the quarter was $96.2 million, up 6.9% from the comparable period of 2021. Operating income increased 13.8% from $8.7 million to $13.0 million year over year. Net income of $8.8 million was also up year over year, increasing by 48.2%.
(02/01/2023)
VSE Corp. announced the acquisition of Precision Fuel Components LLC, in an all-cash transaction. The transaction is expected to be immediately accretive to VSE Corp.’s aviation segment. The exact terms of the deal have yet to be disclosed.
(01/24/2023)
VSE Corp. announced the opening of its new distribution and e-commerce fulfillment center in Tennessee. The new center doubles the company’s existing warehouse space, allowing the company to handle the increase in demand for products it has seen over the past few years.
President and CEO John Cuomo stated, “During the last four years, our commercial fleet sales have grown from approximately 10% to 40% of fleet segment revenue, driven by share gains across both commercial fleet and e-commerce fulfillment channels. Looking ahead, we anticipate this distribution center will contribute more than $50 million in new, incremental sales to our fleet segment in 2023.”
 Get updates about the portfolio that has outperformed the market by 211.9%
since inception!
Get updates about the portfolio that has outperformed the market by 211.9%
since inception!