

John Bajkowski
is the president of AAII.
 AP
BSET
CMT
DFSCX
FRD
HURC
KTCC
MG
NAESX
NC
RCKY
STRT
TITN
VFINX
VPG
AP
BSET
CMT
DFSCX
FRD
HURC
KTCC
MG
NAESX
NC
RCKY
STRT
TITN
VFINX
VPG
The Model Shadow Stock Portfolio review is conducted quarterly after most companies have reported earnings. We completed our review on March 15, 2023, and are still awaiting three companies to report their results for the quarter ending December 31, 2022.
Profitability is the primary quality filter used to add and remove companies within the model portfolio and we were curious to see how the current holdings fared after the Federal Reserve’s aggressive action of attempting to tame inflation by slowing the economy without driving it into a recession.
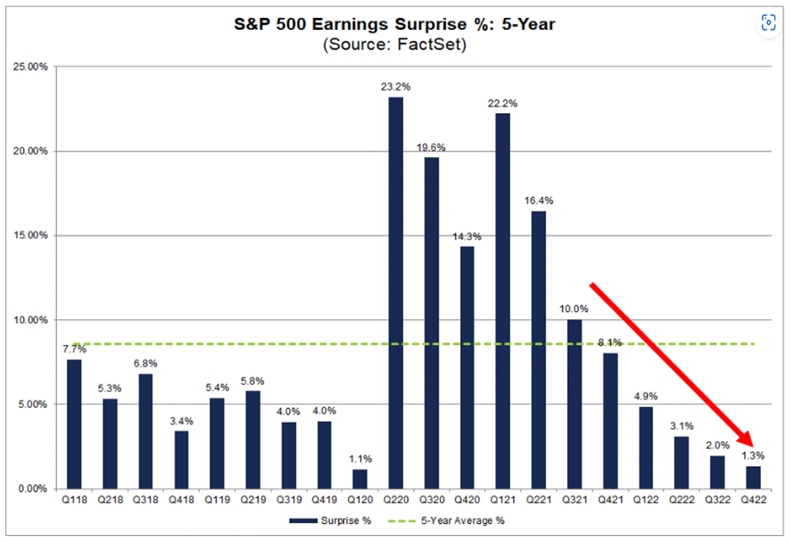
Looking at the market as a whole, earnings for the latest quarter have come in softer than initially projected. FactSet stated that 68% of the S&P 500 index companies reported actual earnings per share above estimates, which is below the five-year average of 77%. The aggregate earnings reported by the companies in the S&P 500 have exceeded the estimated earnings by 1.3%, marking the seventh consecutive quarter in which earnings surprises decreased. Furthermore, 67% of the S&P 500 companies provided negative guidance, higher than the five-year average of 59%. Overall, the S&P 500 reported a 4.9% decline in earnings, the first decline since the third quarter of 2020.
Turning our attention to the Model Shadow Stock Portfolio, one-third of the companies in the model portfolio are truly in the shadows of Wall Street and don’t have any analyst coverage that generates an earnings estimate. Of the 20 stocks with a consensus earnings estimate, 13 (65%) had a positive earnings surprise for the latest quarter. As a whole, the surprises averaged 24.6%, while the median or midpoint surprise was 12.1%. The range was quite wide with Core Molding Technologies Inc.  (CMT) on the high end, reporting $0.57 per share, 307.1% above the $0.14 per share estimate provided by the single analyst following the company. Lazydays Holdings Inc. (LAZY) provided the biggest earning miss with a loss of $0.24 per share, 265.5% below the positive $0.145 average earnings per share estimate provided by the two analysts tracking the company.
The Model Shadow Stock Portfolio seeks positive quarterly and trailing 12-month earnings when adding stocks. However, there is a little leeway when removing stocks from the model portfolio. If a company reports trailing 12-month earnings from continuing operations that are negative, the stock is placed on probation; if a subsequent quarter has negative earnings prior to trailing 12-month earnings becoming positive, the stock is removed. When available, adjusted (non-GAAP) earnings are used to put stocks on probation or remove them. These are earnings that have been adjusted to eliminate the impact of nonrecurring events such as markdown of inventory or goodwill. These are earnings reported in the media and firms reporting consensus estimates. The I/B/E/S adjusted earnings reported in AAII’s Stock Investor Pro are used for Model Shadow Stock Portfolio decisions when they are available.
Coming into the quarter, only Ampco-Pittsburgh Corp. (AP) was on earnings probation. Ampco-Pittsburgh manufactures and sells metal products and customized equipment globally. The company operates through two segments—forged and cast engineered products, and air and liquid processing. The company first went on probation after reporting negative trailing 12-month earnings for the quarter ending December 31, 2021. It has reported positive earnings for each of the last three quarters since going on probation and is not scheduled to report fourth-quarter results until March 21, 2023. The stock remains on probation for now.
During the quarter, Advanced Emissions Solutions Inc. (ADES) reported a loss of $0.17 per share, which pushed its trailing 12-month earnings into the red. Advanced Emissions Solutions provides emissions control and water purification solutions to customers in coal-fired power generation, municipal water and other industries to meet applicable regulations. With a loss for the year, the company is now on earnings probation.
Outside of profitability, the primary factors driving portfolio additions and deletions involve company size and value. Overall, stocks are removed from the model portfolio if earnings turn negative or if strong growth and positive expectations push up the size of the company and its valuation beyond desired levels.
Valuation
The Model Shadow Stock Portfolio selection criteria targets the “cheapest” 10% of domestic stocks as measured by the price-to-book-value (P/B) ratio. The decile breakpoint for value is determined by examining price-to-book levels of domestic companies listed on the New York Stock Exchange (NYSE) and then using the price-to-book breakpoint for stocks listed on all domestic exchanges.
We determined the maximum price-to-book value for the lowest decile (lowest 10%) value universe among NYSE-listed stocks using AAII’s Stock Investor Pro stock screening program. Foreign companies, real estate investment trusts (REITs) and investment holding companies are excluded from the analysis. The price-to-book cutoff increased slightly from 0.84 in December to 0.88 in early March. With the current initial qualifying maximum price-to-book ratio at 0.90, we are leaving it unchanged. Qualifying stocks must have a price-to-book ratio of 0.90 or lower. Stocks in the model portfolio are removed for valuation if they exceed three times the minimum initial price-to-book ratio at the time of a quarterly portfolio review. In other words, for this quarter’s review we used a price-to-book cutoff of 0.90 to screen for stocks to add to the Model Shadow Stock Portfolio and 2.70 (0.90 × 3) as the maximum price-to-book ratio to keep stocks in the portfolio.
Vishay Precision Group Inc. (VPG) has the highest price-to-book-value ratio in the Model Shadow Stock Portfolio. Vishay Precision Group designs and manufactures high-value sensors, weighing solutions and precision measurement systems. Its products are used for a wide range of applications and industries including test and measurement; avionics, military and space; transportation; steel; industrial; and medical, precision agriculture and consumer markets. Its price-to-book ratio of 1.88 on March 14, 2023, is well below the 2.70 value used to remove stocks from the model portfolio. Therefore, no stocks are being removed this quarter for exceeding the valuation limit of the model portfolio.
Size
We then examined market-capitalization levels of the domestic companies listed on the NYSE to determine the size cutoff for the lowest decile. Here, the market-cap level maximum was $297 million, compared to $300 million in December 2022. With the current market-cap cutoff at $300 million, there was no need to change the portfolio rules. The maximum market cap for inclusion in the Model Shadow Stock Portfolio is $300 million, and holdings are removed if their market cap goes above three times the initial criterion at the time of the quarterly review: $900 million.
When we conducted the portfolio review using data as of March 14, 2023, Titan Machinery Inc. (TITN) had a market cap of $917 million, which exceeded the size limit and slated the stock to be removed. On March 15, 2023, however the stock price was down $2.42, or 5.8%, to $39.55 per share ahead of its March 16 earnings announcement for the fiscal quarter ending January 31, 2023. Market cap is determined by multiplying share price by the number of shares outstanding, and the price decline pushed the market cap below the $900 million maximum level for the portfolio. With the recent stock market weakness, no stocks are being removed this quarter for exceeding the size limit of the model portfolio.
Since no stocks met the portfolio deletion rules during the quarterly review, the portfolio holdings remain unchanged.

Model Portfolio Holdings
Running the numbers, 20 stocks met the initial selection criteria for the Model Shadow Stock Portfolio as of March 14, 2023, down from 26 passing companies one month ago.
Of the 20 qualifying companies, eight are currently held in the Model Shadow Stock tracking portfolio: Bassett Furniture Industries Inc. (BSET), Big 5 Sporting Goods Corp. (BGFV), Fonar Corp. (FONR), Friedman Industries Inc. (FRD), Hurco Companies Inc. (HURC), Key Tronic Corp. (KTCC), NACCO Industries Inc. (NC) and Rocky Brands Inc. (RCKY). Qualifying companies are those held in the Model Shadow Stock Portfolio that currently meet the initial addition rules.
AAII members can see and research which companies are currently passing the initial selection criteria in the Shadow Stock Ideas table on AAII.com. The list of Shadow Stock Ideas is updated daily—Tuesday through Saturday. They are designated as “currently qualifies” in the notes column of the Model Shadow Stock Portfolio table on AAII.com. However, if you go online, the notes may not match the list discussed here since the notes on the website table are dynamically updated daily.
Container Store Group Inc. (TCS) came off the qualifying list over the course of the month when its stock price fell below $4.00 per share. Container Store is a specialty retailer of storage and organization products. It was one of the weakest stocks in the portfolio last month, giving up 16.5% during February. On February 7, 2023, Container Store announced third-quarter 2022 financial results. The company reported earnings per diluted share of $0.08, missing the I/B/E/S consensus estimate of $0.123 per share by 35%. Net income for the quarter totaled $4.2 billion, down from $13.7 billion reported in the comparable quarter of 2021. Gross margin of 56.9% was relatively in line with the prior-year quarter. Operating margin decreased from 8.3% to 4.2% year over year. Net profit margin was also significantly depressed at 1.7% for the current quarter, compared to 5.1% in the comparable quarter of 2021.
Lazydays Holdings came off the qualify list when it reported a loss for its most recent quarter. As noted in the news below, Lazydays Holdings announced its fourth-quarter and full-year 2022 financial results. The company reported a net loss per diluted share of $0.24 for the quarter, compared to net income of $0.80 per share in the same quarter of 2021. Full-year net income per diluted share was $2.42, compared to $3.93 per share in 2021. Revenue decreased from $322.5 million in the fourth quarter of 2021 to $243.5 million in the fourth quarter of 2022. Full-year revenue increased from $1.2 billion in 2021 to $1.3 billion in 2022. Separately, on February 15, Lazydays Holdings acquired Findlay RV in Las Vegas, Nevada. The company estimates that the store will add approximately $40 million in annualized revenue. With this addition, Lazydays Holdings operates 19 stores across the U.S. Shares of Lazydays Holdings declined 7.1% during February. The company operates recreational vehicle (RV) dealerships and offers a portfolio of products and services for RV owners and outdoor enthusiasts.
Mistras Group Inc. (MG) came off the qualifying list over the course of the month when its price-to-book level went above 0.90 to 0.94. Shares of Mistras Group gained 4.2% during February. Mistras Group is a provider of integrated technology-enabled asset protection solutions, helping to maximize the safety and operational uptime for industrial and civil assets. As noted in the news section below, on March 8, 2023, Mistras Group reported fourth-quarter 2022 earnings that surpassed the consensus earnings estimate by 12.5%. The stock was up 5.8% during March through March 14, 2023.
One stock started to pass the initial list of qualifying companies again—Rocky Brands. The company is a designer, manufacturer and marketer of footwear and apparel. Its price-to-book ratio fell below 0.90 over the course of the last month as its share price declined 15.4% during February. This price decline came despite the 72.8% positive earnings surprise, noted in the news section below.
The Model Shadow Stock Portfolio was essentially unchanged during February, retaining its year-to-date performance to a gain of 13.9%. The S&P 500, as measured through the Vanguard 500 Index fund (VFINX), was down 2.5% in February and is up 3.7% year to date, while the Vanguard Small Cap Index fund (NAESX) was down 2.3% during February and is up 7.6% for the year. The DFA U.S. Micro Cap fund (DFSCX) was down 0.5% during February and is up 8.2% for the first two months of the year.
Key Tronic was the best-performing stock in the model portfolio, gaining 47.1% during February. On January 31, 2023, Key Tronic reported second-quarter 2023 earnings per share of $0.09, which increased year over year from $0.05 per share. Net sales of $123.7 million decreased 8.0% over the same period. For the second quarter, the company’s gross margin was 7.2% and the operating margin was 2.9%, compared to a gross margin of 7.3% and operating margin of 1.2% in the same period of fiscal-year 2022. For fiscal third-quarter 2023, Key Tronic expects revenue in the range of $160 million to $170 million and earnings in the range of $0.15 to $0.25 per share. Key Tronic is a contract manufacturer offering value-added design and manufacturing services with facilities located in the U.S., Mexico, China and Vietnam.
Strattec Security Corp. (STRT) was the weakest-performing stock in the model portfolio, giving up 18.3% during February. On February 2, 2023, Strattec Security reported financial results for the second fiscal quarter of 2023, ended January 1, 2023. The company reported a diluted loss per share of $0.47 compared to earnings of $0.87 per share in the second quarter of 2021. The sole analyst following the company expected a $0.05 earnings per share gain for the quarter. Net sales for the quarter were $113.2 million, compared to net sales of $112.9 million a year ago. Strattec Security reported a net loss of $1.8 million in the quarter, compared to net income of $3.4 million in the comparable period one year ago. Strattec Security is supplier of automotive systems with a focus on “smart” vehicle power access and electronic and security solutions.
Generally, growth segments performed better than value-oriented stocks during February. In the large-cap segment, growth stocks were down 1.9% for the month and are now up 3.6% for the year. Large-cap value stocks were down 3.0% during February and are now up 3.8% year to date.
In the mid-cap segment, value stocks are up 8.3% for the year, after losing 2.8% during February. Mid-cap growth stocks are up 6.2% for the year, after only losing 0.8% during the month.
Small-cap value stocks are up 7.0% year to date, while small-cap growth stocks are up 8.8% for the year. During February, small-cap value stocks lost 2.3%, and small-cap growth stocks lost 1.1%.
Since its inception in 1993, the AAII Model Shadow Stock Portfolio has a compound annual average return of 13.9% versus the Vanguard 500 Index fund’s gain of 9.6% per year on average over the same period. The Vanguard Small Cap Index had an average annual total return gain of 9.8% over the same period.
Click here to see the current addition and deletion rules for the portfolio.
The next quarterly review of the AAII Model Shadow Stock Portfolio will take place around the beginning of June 2023, after most of the holdings have announced their quarterly earnings. Any changes to the portfolio will be announced at the time they are made in a special Model Shadow Stock Portfolio Update email (sign up at www.aaii.com/email).
(03/08/2023)
Advanced Emissions Solutions reported a fourth-quarter 2022 non-GAAP loss per share of $0.17, fourth-quarter revenue of $23.4 million and full-year revenue of $103.0 million. The company recorded a net loss of $8.9 million, or a loss of $0.48 per diluted share, during the full year compared to net income of $60.4 million, or $3.27 per diluted share, in 2021. The company reported a quarterly loss in adjusted earnings before interest, taxes, depreciation and amortization (EBITDA) of $1.2 million, compared to adjusted EBITDA of positive $9.1 million in the prior year.
Bassett Furniture Industries, Incorporated (BSET)
(03/09/2023)
Bassett Furniture Industries declared a quarterly dividend of $0.16 per share, in line with the previous year. The dividend is payable on May 26 to shareholders of record at the close of business on May 12. The stock will trade ex-dividend on Thursday, May 11. Bassett Furniture has paid a dividend since 1989. It has a current dividend yield of 3.4%.
Big 5 Sporting Goods Corporation (BGFV)
(02/28/2023)
Big 5 Sporting Goods reported fourth-quarter revenue of $238.3 million, representing a 12.8% decrease from that of the prior-year period. The company also reported that it ended fiscal 2022 with no borrowings under its credit facility and a cash balance of approximately $25.6 million. The company reported non-GAAP earnings per share of $0.08, beating the I/B/E/S consensus estimate of $0.070 per share by 14.3%. This is a decrease of 91.0% compared to the same quarter last year. Full-year 2022 earnings were $1.19 per share, representing a 73.8% decrease from 2021.
“2022 was a dynamic year. Our team contended with accelerating headwinds in the form of persistent inflation on our expense structure, as well as related macroeconomic impacts that softened discretionary spending. In the face of these headwinds, we produced a solid year of earnings, benefiting from disciplined inventory management that enabled us to prioritize merchandise margins to drive gross profit dollars. Our business ended the year in a solid financial condition with a strong debt-free balance sheet supported by a healthy inventory position,” said CEO Steven G. Miller.
Big 5 Sporting Goods also declared a quarterly cash dividend of $0.25 per share, which is payable on March 24 to stockholders of record as of March 10.
(03/03/2023)
(2/27/2023) Clarus reported fourth-quarter revenue of $104.2 million, representing an 11.8% decrease from $118.2 million of the same period last year. The company reported non-GAAP earnings per share of $0.20, missing the I/B/E/S consensus estimate of $0.223 per share by 10.3%. This is a decrease of 55.6% compared to the same quarter last year. Full-year 2022 earnings were $1.16 per share, representing a 20.5% decrease from 2021.
“While 2022 will go down as one of our most challenging years given various macroeconomic headwinds, our brands were largely resilient, and our team was nimble and tenacious,” said president John Walbrecht. “As the challenges set in, we acted quickly by pivoting to areas of our business experiencing less headwinds, and we prioritized expense reductions, free cash flow generation, and debt reduction.”
Core Molding Technologies, Inc. (CMT)
(03/14/2023)
Core Molding Technologies reported fourth-quarter 2022 non-GAAP earnings per share of $0.57. Revenue was $86.4 million, up 18.1% from $73.2 million in the prior year. The company had adjusted earnings before interest, taxes, depreciation and amortization (EBITDA) of $6.1 million, or 7.0% of net sales, compared to $4.9 million, or 6.8% of net sales in the prior year.
“2022 was a record sales, net income and adjusted EBITDA year for the company … Higher 2022 sales were driven by new business launches from our program wins over the past two years, strong demand from customers and price increases to recoup inflationary raw material costs. Major programs launches in 2022 are expected to result in a continuation of sales momentum in 2023 and offset negative impacts of macroeconomic events,” said CEO David Duvall.
(02/23/2023)
Escalade announced fourth-quarter and full-year 2022 results. The company reported full-year earnings per diluted share of $1.31, down from $1.76 per share in 2021. Net sales for the year totaled $313.6 million, almost identical to the figure reported in 2021. On a year-over-year basis, gross profit declined 4.5%, operating income declined 17.5% and net income declined 26.3%.
Escalade announced a quarterly dividend of $0.15 per share payable on March 20 to shareholders of record as of March 13.
Effective January 1, 2023, Escalade transitioned to a conventional 12-month reporting calendar. The fourth quarter of 2022 ended on December 31, 2022.
(03/01/2023)
Global Ship Lease announced fourth-quarter and full-year 2022 results. Earnings were $2.14 per share, 27.3% above the I/B/E/S consensus estimate of $1.68 per share. Compared to the fourth quarter of 2021, GAAP net income increased 9.8% to $72.6 million. Full-year revenue was 645.6 million, a 44.1% increase from the previous year.
Executive chairman George Youroukos said, “Global Ship Lease has continued to make important financial, commercial and strategic progress—including active cooperation to improve vessel efficiency and reduce emissions that will serve well in the long term. Our scale, relationships throughout the industry and high-quality fleet have enabled us to remain consistently active in fixing vessels at profitable rates.”
Hooker Furnishings Corporation (HOFT)
(03/06/2023)
Hooker Furnishings declared a quarterly cash dividend of $0.22 per share, payable on March 31.
(03/10/2023)
Hurco Companies announced first-quarter 2023 results. Diluted earnings were $0.20 per share compared to diluted earnings per share of $0.53 for the comparable quarter in 2022. Sales revenue totaled $54.7 million, an 18% decrease over the first quarter of 2021.
CEO Greg Volovic said, “The global machine tool market is experiencing some oscillation in demand that seems unpredictable, but we plan to continue our strategy to innovate and invest in new and advanced technology, allowing us to be opportunistic and prepared for the upside of the market cycle when it comes.”
Lazydays Holdings, Inc. (GORV)
(02/23/2023)
Lazydays Holdings announced fourth-quarter and full-year 2022 financial results. Net loss per diluted share was $0.24 for the quarter, compared to net income of $0.80 per share in the same quarter of 2021. Full-year net income per diluted share was $2.42, compared to $3.93 per share in 2021. Revenue decreased from $322.5 million in the fourth quarter of 2021 to $243.5 million in the fourth quarter of 2022. Full-year revenue increased from $1.2 billion in 2021 to $1.3 billion in 2022.
On February 15, Lazydays Holdings acquired Findlay RV in Las Vegas, Nevada. The company estimates that the store will add approximately $40 million in annualized revenue. With this addition, Lazydays Holdings operates 19 stores across the U.S.
(03/08/2023)
Mistras Group reported fourth-quarter 2022 revenue of $168.2 million and earnings per share of $0.09, above the I/B/E/S consensus estimate of $0.08 per share. For the full year, revenue of $687.4 million increased 1.5% as reported, yet an increase of 3.7% excluding the impact of unfavorable foreign currency exchange of $15.2 million. Net income was $6.5 million for full-year 2022, compared to net income of $3.9 million in 2021.
Revenue increased due to improved sales mix. CEO Dennis Bertolotti stated that core markets have shown resiliency, and the company is seeing a surge in demand for its more recently launched data solutions offering.
(03/15/2023)
NACCO Industries announced fourth-quarter and full-year 2022 results. Fourth-quarter operating profit increased to $15.5 million, up 43.7% over the fourth quarter of 2021. Fourth-quarter net income increased to $13.8 million, or $1.84 per share. This is up from $7.8 million, or $1.07 per share, in the comparable quarter of 2021. Fourth-quarter earnings before interest, taxes, depreciation and amortization (EBITDA) increased to $23.6 million, up 32.9% over the prior-year quarter. Full-year 2022 net income increased to $74.2 million, or $10.06 per share, up from $48.1 million, or $6.69 per share in 2021.
(02/22/2023)
NACCO Industries declared a dividend of $0.2075 per share, payable on March 15, to shareholders of record as of March 7. The stock will trade ex-dividend on Monday, March 6. This dividend is in line with previous declarations. NACCO Industries has paid a dividend for 36 years and has raised it for nine consecutive years.
Pangaea Logistics Solutions Ltd. (PANL)
(03/15/2023)
Pangaea Logistics Solutions announced fourth-quarter and full-year 2022 results. Fourth-quarter earnings per diluted share were $0.34, unchanged year over year. Full-year earnings per diluted share totaled $1.76, an increase of 17% year over year. Full-year operating cash flow was $134.8 million, a 118% increase over full-year 2021. The company has cash and cash equivalents of $128.4 million as of the end of 2022, a $72.2 million increase over the end of 2021.
(02/23/2023)
Rocky Brands announced fourth-quarter and full-year 2022 financial results. Adjusted net income per diluted share was $1.09 for the quarter, beating the I/B/E/S consensus estimate of $0.625 per share by $0.455, or 72.8%.
On a full-year basis compared to 2021, adjusted net income decreased 26.0% to $24.1 million, or $3.27 per diluted share. Net sales increased 19.7% to $615.5 million. Wholesale segment sales increased 24.0%. Retail segment sales increased 21.9% and operating income increased 22.4% to $44.0 million. Net income remained flat at $20.5 million, or $2.78 per diluted share.
(03/08/2023)
VSE Corp. announced fourth-quarter and full-year 2022 results. VSE Corp. reported earnings of $0.75 per share, 9.3% below the I/B/E/S consensus estimate of $0.68 per share. Compared to fourth-quarter 2021, GAAP net income decreased 22% to $4.8 million. Full-year revenue was $949.8 million, a 26% increase year over year. GAAP net income of $28.1 million increased 252% year over year and adjusted diluted earnings per share of $2.91 increased 32% over 2021.
CEO John Cuomo said, “We completed a defining year in our company’s history by delivering strong fourth-quarter and full-year results as we advanced our business transformation strategies, culminating in significant year-over-year growth, robust new business wins and record full-year revenue in our aviation and fleet segments.”
 Get updates about the portfolio that has outperformed the market by 211.9%
since inception!
Get updates about the portfolio that has outperformed the market by 211.9%
since inception!