

John Bajkowski
is the president of AAII.
 AMPY
APT
CMT
CTRM
DFSCX
EML
ESCA
FRD
GASS
GILT
NAESX
PANL
PKOH
RCKY
RGS
SDHC
VFINX
AMPY
APT
CMT
CTRM
DFSCX
EML
ESCA
FRD
GASS
GILT
NAESX
PANL
PKOH
RCKY
RGS
SDHC
VFINX
The Model Shadow Stock Portfolio lost 2.9% in March—a difficult and volatile month for equities. The S&P 500 index declined 5.0%, while the S&P MidCap 400 index fell 5.4% and the S&P SmallCap 600 index dropped 4.1%. The portfolio also held up slightly better than small- and micro-cap benchmarks, including Vanguard Small Cap Index fund  (NAESX), which declined 5.2%, and DFA U.S. Micro Cap I fund (DFSCX), which fell 3.4%.
March’s market weakness was heavily influenced by escalating geopolitical tensions, particularly the Iran war, which created significant disruption across global energy and financial markets. Oil prices surged sharply during the month—rising more than 40% at one point—as concerns grew over supply disruptions through the Strait of Hormuz, a critical route for roughly 20% of global oil flows. This shock contributed to a broad risk-off environment, pressuring equities while simultaneously driving strength in energy-related stocks.
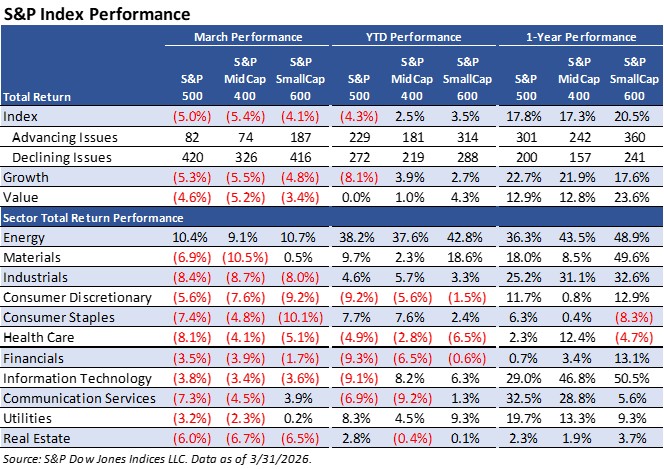
Market breadth deteriorated meaningfully during the month, with declining issues far outnumbering advancing stocks across all major indexes. Growth stocks led the decline, falling between 4.8% and 5.5% across size segments, while value stocks held up relatively better but still posted losses. Sector performance was broadly negative, with economically sensitive sectors such as industrials, consumer discretionary and materials experiencing some of the steepest declines. In contrast, energy was a notable outlier, delivering gains of between 9% and 11% across all size groups, supported by higher crude oil prices and tightening global supply conditions tied to the war.
Year to date, the Model Shadow Stock Portfolio is up 12.0%, dramatically outperforming the major indexes. The S&P 500 is down 4.3% year to date, while mid-cap and small-cap indexes are modestly positive, gaining 2.5% and 3.5%, respectively. The model portfolio has also exceeded returns from small- and micro-cap benchmarks, with Vanguard Small Cap Index up 1.9% and DFA U.S. Micro Cap I up 4.2% over the same period.
Sector trends help explain this divergence. Energy is the strongest-performing sector year to date, rising more than 37% across all size segments, benefiting directly from the supply shock and elevated pricing environment. At the same time, several growth-oriented and rate-sensitive sectors, including consumer discretionary, financials and communication services, have struggled amid rising uncertainty, higher input costs and tightening financial conditions. This environment has been supportive of the Model Shadow Stock Portfolio, which emphasizes low price-to-book, asset-based and often cyclical companies that can benefit from commodity strength and valuation rerating.
Industry and sector competition play a strong role in company performance and stock price valuations. The Model Shadow Stock Portfolio follows a deep-value micro-cap strategy using the price-to-book-value (P/B) ratio as its primary valuation filter. Notably, the Shadow Stock screen excludes stocks in the financials sector since their financial ratios are not comparable to firms in other sectors. Not surprisingly, the sector weights of the Model Shadow Stock Portfolio are quite different from those of the S&P 500. What is equally surprising is how the sector weights vary across the three S&P indexes.
The table below provides the weighted-average sector weights of the Model Shadow Stock Portfolio as well as the three S&P indexes. S&P Global Market Intelligence supplies the fundamental stock data for AAII’s stock screening and research database, Stock Investor Pro. It has slightly different sector designations than those used by S&P Dow Jones Indices, but the results are equally revealing.
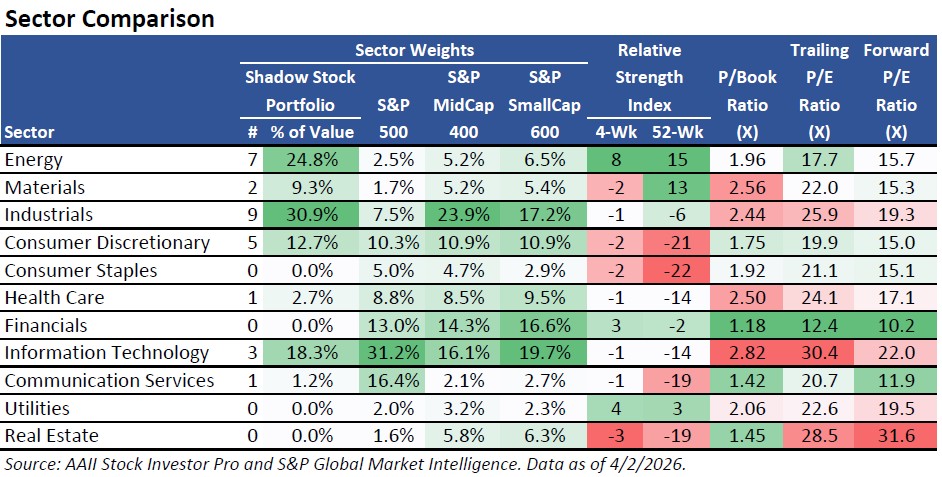
The sector weights have been highlighted to easily show the dominant sectors across the indexes. Higher weights are more darkly shaded. For sector median values of key factors, green cells reflect stronger figures, while red cells mark relatively weaker characteristics.
The Model Shadow Stock Portfolio remains heavily tilted toward cyclical and asset-based sectors, with notable overweight positions in the industrials, energy and materials sectors. The industrials sector represents the largest allocation at 30.9% of the portfolio—well above its weight in the S&P indexes—followed by the energy sector at 24.8% and the materials sector at 9.3%. These three sectors collectively account for more than 65% of portfolio value, reflecting the strategy’s current emphasis on economically sensitive companies and tangible asset exposure.
The portfolio’s energy sector allocation stands out as particularly significant, with a weighting several times larger than that of the major indexes. This positioning has been beneficial given the sector’s strong performance, supported by higher oil prices and geopolitical tensions. Sector-level data also show the energy sector with strong relative strength over both the four-week and 52-week periods, reinforcing its leadership role within the current market environment.
In contrast, the portfolio maintains little to no exposure to traditionally defensive sectors, including consumer staples, utilities, real estate and financials, all of which have meaningful representation in the broader market.
Sector median data provides additional context for the broader opportunity set. Valuation metrics such as price-to-book ratios remain relatively moderate across cyclical sectors, while price-earnings (P/E) ratios in sectors like industrials and information technology are higher, suggesting that earnings expectations and recovery assumptions remain embedded in current pricing. Growth and profitability measures vary widely across sectors, highlighting the uneven nature of the current economic environment, with stronger fundamentals in sectors such as energy and financials and more mixed trends in consumer-oriented and industrial segments.
Relative strength trends at the sector level are also mixed. While the energy and materials sectors show strong longer-term momentum, several sectors—including industrials, consumer discretionary, consumer staples and real estate—have experienced more recent short-term weakness, consistent with the broader market pullback in March.
Overall, the portfolio’s sector composition underscores its contrarian and cyclical orientation, with an emphasis on underfollowed companies tied to industrial activity, commodity trends and economic recovery. This positioning can lead to periods of increased volatility but also provides the potential for outsized gains when market leadership shifts toward value and economically sensitive sectors.
Since its inception in 1993, the AAII Model Shadow Stock Portfolio has a compound average annual return of 13.6%, versus Vanguard 500 Index fund’s (VFINX) average annual gain of 10.4% over the same period. Since the model portfolio’s inception, Vanguard Small Cap Index posted an average annual gain of 9.9%.
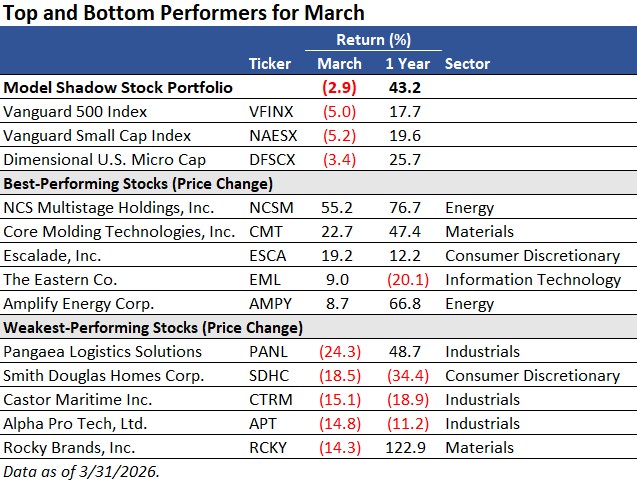
Several holdings delivered strong gains in March, led by NCS Multistage Holdings Inc. (NCSM), which surged 55.2% during the month and is now up 76.7% over the last year. The energy services company reported strong fourth-quarter 2025 results, and the stock benefited from rising oil prices, which have supported demand expectations for completion and production services.
Core Molding Technologies Inc. (CMT) gained 22.7% in March and is up 47.4% over the past year. The manufacturer reported strong year-over-year growth in revenue and earnings during the month, reinforcing signs of improving demand across its industrial and transportation end markets.
Consumer discretionary company Escalade Inc. (ESCA) rose 19.2% during the month and is up 12.2% over the past year. The leisure products company appears to be benefiting from stabilizing demand and improved operating efficiency, which helped support strong year-over-year earnings growth in fourth-quarter 2025.
Industrials company Eastern Co. (EML) advanced 9.0% in March, though it remains down 20.1% over the past year. The stock was added to the Model Shadow Stock Portfolio on March 10, 2026.
Rounding out March’s top performers was Amplify Energy Corp. (AMPY), which gained 8.7% during the month and is now up 66.8% over the past year. The oil and gas producer benefited from higher crude oil prices, which have improved cash flow expectations and supported valuations across the energy sector.
On the downside, Pangaea Logistics Solutions Ltd. (PANL) declined 24.3% in March, though it remains up 48.7% over the past year. The dry bulk shipping company reported fourth-quarter 2025 results during the month that fell short of expectations. The decline also comes as shipping markets have shown signs of softening, with lower freight rates and uncertainty around global trade activity pressuring the group. This also weighed on fellow marine transportation company Castor Maritime Inc. (CTRM), which fell 15.1% during March and is down 18.9% over the past year.
In the consumer discretionary sector, Smith Douglas Homes Corp. (SDHC) declined 18.5% in March and is down 34.4% over the past year. Homebuilding stocks continue to face pressure from elevated interest rates, which have constrained affordability and tempered demand for new housing. The 30-year fixed mortgage has risen to around 6.5% after falling below 6.0% at the end of February.
Industrial building supply company Alpha Pro Tech Ltd. (APT) fell 14.8% during the month and is down 11.2% over the past year. The company reported a year-over-year decline in revenue and earnings, noting that high-tariffed inventory and pricing pressures in the roofing sector continued to weigh on overall profitability.
Finally, Rocky Brands Inc. (RCKY) declined 14.3% in March but remains up 122.9% over the past year. The pullback likely reflects some profit-taking following a strong multimonth advance.
The wide range of returns among March’s top and bottom performers highlights the inherent volatility that often accompanies investing in smaller companies. Individual stocks can move sharply in response to earnings results, shifts in investor sentiment or changes in industry conditions. While these short-term swings can be uncomfortable, they are also a normal part of small-cap investing. Maintaining a disciplined, diversified approach and focusing on long-term fundamentals remains central to the Model Shadow Stock Portfolio strategy. Over time, this approach seeks to capture the opportunities that frequently exist among deeply discounted, smaller, less widely followed companies.
As of April 2, 29 stocks met the initial selection criteria for the Model Shadow Stock Portfolio, compared to 24 stocks one month ago. AAII members can see and research which companies are currently passing the initial selection criteria in the Shadow Stock Ideas table on AAII.com. The list of new Shadow Stock Ideas is updated daily—Tuesday through Saturday.
Of the 29 qualifying companies, eight are currently held in the Model Shadow Stock Portfolio: Alpha Pro Tech, Amplify Energy, Fonar Corp. (FONR), Eastern Co. Friedman Industries Inc. (FRD), Park-Ohio Holdings Corp. (PKOH), Regis Corp. (RGS) and StealthGas Inc. (GASS).
Qualifying companies are those held in the Model Shadow Stock Portfolio that currently meet the initial portfolio addition rules. (They are designated as “currently qualifies” in the Notes column of the Model Shadow Stock Portfolio table on AAII.com. However, if you go online, the notes may not match the list discussed here since the notes on the website table are dynamically updated daily.)
No current holdings came off the qualifying list over the last month, but more companies are passing the Shadow Stock screen, as declining stock prices are lowering companies’ price-to-book ratios and market caps.
As of April 2, Israel-headquartered communication equipment company Gilat Satellite Networks Ltd. (GILT) had the highest price-to-book ratio in the Model Shadow Stock Portfolio. Its ratio of 2.41 is above the 1.00 maximum value used for initially qualifying a stock for inclusion in the portfolio. However, stocks are not removed from the portfolio until their price-to-book ratio rises to three times the initial maximum value (3.00).
Gilat Satellite also had the highest market cap in the portfolio, with a value of $1.214 billion as of April 2. The Model Shadow Stock Portfolio looks for stocks with a market cap (share price times shares outstanding) greater than $30 million but less than $400 million when adding stocks to the portfolio. Shadow stocks with a market cap three times the initial market-cap maximum ($400 million × 3 = $1.2 billion) at the time of a quarterly review are removed from the portfolio, assuming there is a suitable replacement. Gilat Satellite’s market cap fell just below the deletion threshold during our quarterly review in March.
Click here to see the current addition and deletion rules for the portfolio.
The next quarterly review of the AAII Model Shadow Stock Portfolio will take place around the beginning of June, after most of the holdings have announced their first-quarter 2026 earnings. If there are any changes to the model portfolio, they will be announced in the Model Shadow Stock Portfolio Update email. Sign up for this email so you don’t miss it!
(03/11/2026)
Alpha Pro Tech reported fourth-quarter 2025 earnings of $0.07 per share, down from $0.08 per share in the prior-year quarter. Alpha Pro Tech does not have earnings coverage by S&P Global. Consolidated sales were $13.9 million, up from $13.8 million in the prior-year quarter. Gross profit was $5.1 million, down 1.0% year over year from $5.2 million. Net income margin was 5.1%, down from 6.1% in the prior-year quarter. Net income was $700,000, down 17.6% year over year from $800,000. The company maintained a strong liquidity position, with $17 million in cash and no debt, and continued activity in its share repurchase program. Key performance factors included a shift in the building supply mix. High-tariffed inventory and pricing pressures in the roofing sector continued to weigh on overall profitability.
Core Molding Technologies, Inc. (CMT)
(03/12/2026)
Core Molding Technologies announced a $7.5 million share repurchase program. According to the company, this new buyback authorization “reflects our strong financial position, our confidence in the company’s long-term growth prospects and our commitment to enhancing shareholder value.”
(03/10/2026)
Core Molding Technologies reported earnings of $0.36 per share for fourth-quarter 2025. The company does not have earnings coverage by S&P Global. Revenue was $74.7 million, up 19.5% year over year from $62.5 million. Adjusted EBITDA was $7.6 million, up 33% year over year, with an EBITDA margin of 10.2%. Net profit attributable to owners was $3.1 million, up from a net loss of $39,000 in the prior-year quarter. The company attributed this strong performance to successful diversification into new markets and elevated tooling revenue from recent business wins.
Full-year 2025 operating cash flow was over $19 million. The company ended the year with total liquidity of $88.1 million.
Gilat Satellite Networks Ltd. (GILT)
(03/10/2026)
Gilat Satellite secured approximately $6 million in new orders through its subsidiary, Gilat DataPath, to provide technical and field services for the U.S. Army. These services, which support global military communications operations, are scheduled for delivery over the next six months under the GTACS II contract vehicle. The award reinforces a long-standing partnership between Gilat Satellite and the U.S. Army’s Program Executive Office for Command, Control, Communications and Networks. The deal further strengthens Gilat Satellite’s growing defense portfolio as the company continues to provide mission-critical satellite networking solutions on a global scale.
Natural Gas Services Group, Inc. (NGS)
(03/16/2026)
Natural Gas Services Group reported adjusted fourth-quarter 2025 diluted earnings of $0.521 per share. Earnings were 48.8% above the S&P Global consensus estimate of $0.35 per share. Total revenue was $46.1 million, up 13.5% year-over-year from $40.7 million. Rental revenue increased 16.0% but revenue from sales and aftermarket services decreased. Operating income was $7.1 million, up 17.7% over the same period from $6.0 million. For full-year 2026, the company forecasts adjusted EBITDA of $90.5 million to $95.5 million.
Pangaea Logistics Solutions Ltd. (PANL)
(03/10/2026)
Pangaea Logistics Solutions reported fourth-quarter 2025 adjusted earnings of $0.16 per share, unchanged year over year. Earnings were 30.4% below the S&P Global consensus estimate of $0.23 per share. Total revenues were $183.9 million, up 24.9% year over year from $147.2 million, with growth in the voyage, charter, and port terminal and stevedore revenue segments. Operating income was $17.4 million, up 17.8% year over year from $14.8 million.
During full-year 2025, the company returned $19.3 million to shareholders through dividends and $3.0 million through share repurchases.
Saga Communications, Inc. (SGA)
(03/12/2026)
Saga Communications reported a fourth-quarter 2025 diluted loss of $1.07 per share, a decrease from the prior year quarter’s earnings of $0.20 per share. S&P Global does not provide a consensus earnings estimate for Saga Communications. Net operating revenue was $26.5 million, down 9.3% year-over-year from $29.2 million. The operating loss was $9.5 million, down from fourth-quarter 2024 operating income of $1.0 million. For the quarter, the company recorded an impairment charge of $20.4 million based on an evaluation of goodwill and FCC license values. The company states that without the impairment charge, operating income would have been $10.9 million for the quarter and net income would have been $8.2 million or $1.27 per share.
(03/12/2026)
Saga Communications reported a diluted loss of $1.07 per share for fourth-quarter 2025, down from earnings of $0.20 per share in the prior-year quarter. Saga Communications does not have earnings coverage by S&P Global. Net operating revenue was $26.5 million, down 9.3% year over year from $29.2 million. The company reported an operating loss of $9.5 million, down from operating income of $984,000 in the prior-year quarter. The company attributed these losses to a $20.4 million impairment charge.
During the quarter, the company returned $1.6 million to shareholders through dividends and $2.4 million through share repurchases.
Smith Douglas Homes Corp. (SDHC)
(03/11/2026)
Smith Douglas Homes reported fourth-quarter 2025 earnings of $1.408 per share, up 203.4% from $0.464 per share in the prior-year quarter. Earnings were 1,157.1% above the S&P Global consensus estimate of $0.112 per share. Home closing revenue was $260.4 million, down 9.4% year over year from $287.5 million, with southeast closing revenue decreasing and central closing revenue growing 1.0%. Home closings were 780, down 6.7% year over year from 836.
 Get updates about the portfolio that has outperformed the market by 211.9%
since inception!
Get updates about the portfolio that has outperformed the market by 211.9%
since inception!