


John Bajkowski
is the president of AAII.
“Sell in May and go away” is an old Wall Street saying rooted in the relative weaker performance of the market over the summer and extending through October. Some also refer to it as the Halloween strategy, noting that the market’s strongest relative performance is normally between October 31 and the end of April. With the Halloween strategy, you are invested in the market for six months (November through April) and out of the market for six months (May through October).
These common adages get widespread coverage, but should investors use them as strategies to manage their portfolios? To help answer that question, we examined the performance of the Model Shadow Stock Portfolio as well as the S&P 500 index as measured by the Vanguard 500 Index fund  (VFINX).
We have observed that the weakest-performing months for the Model Shadow Stock Portfolio over its 30-plus-year history are August (0.4% average return), September (0.4%) and May (0.7%). In contrast, the three best-performing months are November (2.2% average return), January (2.0%) and April (1.9%).
For the S&P 500, the weakest-performing months over the same period of time have been September (–0.5% average return), August (–0.1%) and February (–0.1%). The three best-performing months for the S&P 500 have been November (2.2% average return), April (2.0%) and October (1.9%).
The table below is color coded to highlight the strongest months in green and the weakest months in red. In general, weaker months tend to be clustered in late summer and the strongest months tend to be clustered in late fall and early winter. However, the pattern is not perfect. The average return in July has been above the norm for the Model Shadow Stock Portfolio and the Vanguard 500 Index fund, while the average February return is below the norm. The small-cap January effect shows up for the Model Shadow Stock Portfolio and the DFA U.S. Micro Cap fund (DFSCX). The January effect is the tendency for small-company stocks to perform well in the beginning of the year.

Taking the analysis further, we thought it would be interesting to see if the Halloween strategy applies to the Model Shadow Stock Portfolio. If you held the Model Shadow Stock Portfolio every November through April from 1993 to 2022, you would have realized an 8.5% average annual rate of return, meaningfully higher than the 4.7% annual rate of return observed for the 29 six-month holding periods from May through October. The November through April holding periods outperformed the preceding May through October holding periods in 18 out of 29 years.
We noticed a similar pattern with the Vanguard 500 Index fund. The May through October holding period underperformed the November through April holding period: 3.0% versus 6.7%. The November through April holding periods outperformed the preceding May through October holding periods in 17 out of 29 years.
While we are ignoring the transaction costs in this analysis, the Halloween strategy identifies the relatively stronger and weaker six-month holding periods of the stock market. But before you sell all your stock holdings at the end of April, you should consider that even though the market return has been relatively weaker from May through October, it has been positive on average and much higher than the return you would have earned on Treasury bills while out of the market. The average annual compound rate of return for T-bills from May through October over the last 29 years has been 1.2%.
By including the Model Shadow Stock Portfolio 4.7% average compound rate of return from the May through October holding periods, we see the 8.5% return of the November through April time period expand to 13.7% annually for the full May 1993 through October 2022 period. Adding the 1.2% average annual T-bills return for the May through October periods would only have increased your rate of return from 8.5% to 9.9% for the Model Shadow Stock Portfolio. Just in case you are wondering, 8.5% and 1.2% equals 9.9% due to the magic of compounding.
The same is true for the Vanguard 500 Index fund. Investors would have earned a 9.8% annual return by staying fully invested, compared to an 8.0% average annual return by being invested in the S&P 500 from November through April and T-bills from May through October.
So, while the market tends to undergo the summer doldrums, it has still generally rewarded investors for staying invested over the long term.
Twenty-five stocks met the initial selection criteria for the Model Shadow Stock Portfolio as of April 11, 2023, up from 20 passing stocks one month ago. Of the 25 qualifying stocks, 10 are currently held in the Model Shadow Stock tracking portfolio: Bassett Furniture Industries Inc. (BSET), Big 5 Sporting Goods Corp. (BGFV), Fonar Corp. (FONR), Friedman Industries Inc. (FRD), Hooker Furnishings Corp. (HOFT), Hurco Companies Inc. (HURC), Key Tronic Corp. (KTCC), NACCO Industries Inc. (NC), Pangaea Logistics Solutions Ltd. (PANL) and Rocky Brands Inc. (RCKY). Qualifying companies are those held in the Model Shadow Stock Portfolio that currently meet the initial purchase rules. (They are designated as “currently qualifies” in the notes column of the Model Shadow Stock Portfolio table on AAII.com. However, the notes may not match the list here since the passing list on the website is revised daily and the notes are dynamically updated.)
Two of the stocks started to pass the initial list of qualifying companies again—Hooker Furnishings and Pangaea Logistics Solutions. Weakness in their stock prices pushed their price-to-book-value (P/B) ratios below 0.90 over the course of the last month.
As of April 11, 2023, Vishay Precision Group Inc. (VPG) had the highest price-to-book ratio in the Model Shadow Stock Portfolio. Vishay Precision Group designs and manufactures high-value sensors, weighing solutions and precision measurement systems. Its products are used for a wide range of applications and industries, including test and measurement; avionics, military and space; transportation; steel; industrial; and medical, precision agriculture and consumer markets. Its price-to-book ratio of 1.81 is above the 0.90 maximum value used for initially qualifying a stock for inclusion in the portfolio. However, stocks are not removed from the portfolio until their price-to-book ratio rises to three times the initial maximum value, 2.70. It may help you to think about values below 0.90 as attractive, while values three times above the initial maximum are expensive. Allowing the price-to-book ratio to expand for stocks you own allows your winners to run up a little, since the price-to-book ratio typically increases as the stock price goes up. The initial price-to-book level is adjusted over time to reflect changing market conditions.
The Model Shadow Stock Portfolio looks for stocks with market capitalizations (share price times shares outstanding) greater than $30 million but less than $300 million when adding stocks to the portfolio. Shadow Stocks with a market cap three times the initial market cap maximum ($300 million × 3 = $900 million) at the time of a quarterly review are sold from the portfolio, assuming there is a suitable replacement. Titan Machinery Inc. (TITN) has the highest market cap in the portfolio, with a value of $648.7 million as of April 11, 2023. As noted in the news section below, Titan Machinery reported fiscal fourth-quarter and full-year 2022 financial results in March that disappointed investors. While revenue and net income increased strongly year over year, results were below expectations, sending the stock price lower.
Click here to see the current addition and deletion rules for the portfolio.
The Model Shadow Stock Portfolio lost 5.1% during March, reducing its year-to-date gain to 8.0%. The S&P 500 as measured through the Vanguard 500 Index fund was up 1.1% in March and is up 7.5% year to date, while the Vanguard Small Cap Index fund (NAESX) lost 5.8% in March and is up 3.7% year to date. The DFA U.S. Micro Cap fund was down 5.5% during March and is up 2.8% for the year.
The fallout from the rapid collapse of Silicon Valley Bank and Signature Bank hurt the financials sector and the share prices of smaller companies that are more reliant on regional banking. We normally report the performance of the 11 sectors that make up the S&P 500 and thought it would be interesting to see how the sector performance varies across market-cap segments.
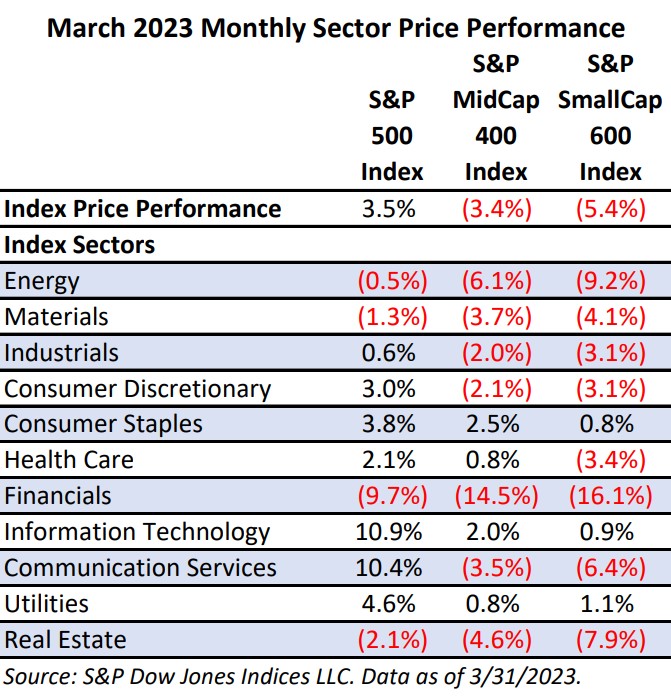
The financials sector was the weakest sector during March, down 9.7% within the S&P 500. The stock price performance was weaker for the smaller market cap indexes: The financials sector within the S&P MidCap 400 index was down 14.5% and down 16.1% within the S&P SmallCap 600 index.
Other sectors within the S&P 500 down for the month were real estate (–2.1%), materials (–1.3%) and energy (–0.5%).
Within the S&P 500, the best-performing sectors were information technology (10.9%), communication services (10.4%) and utilities (4.6%). Investor money rotated out of the financials sector and into larger technology companies.
Generally, growth segments performed better than value-oriented stocks during March and larger companies outperformed smaller companies. In the large-cap segment, growth stocks were up 5.9% for the month, bringing their year-to-date performance to a gain of 9.6% for 2023. Large-cap value stocks were up 1.3% during March and are now up 5.2% year to date. The S&P 500 had a total return of 3.7% for the month, compared to the total-return loss of 3.2% for the S&P MidCap 400 and a loss of 5.2% for the S&P SmallCap 600.
In the mid-cap segment, growth stocks were down 1.1% during March and are now up 5.0% year to date. Mid-cap value stocks were down 5.3% for the month, reducing their year-to-date performance to a gain of 2.5%.
Small-cap growth stocks declined 4.0% during March, compared to a decline of 6.4% for small-cap value stocks. For the year, however, small-cap value stocks are up 3.1%, while small-cap growth stocks are up 2.1% during the first three months of the year.
Since its inception in 1993, the AAII Model Shadow Stock Portfolio has a compound annual average return of 13.7% versus the Vanguard 500 Index fund’s gain of 9.7% per year on average over the same period. Over the same period, the Vanguard Small Cap Index fund posted an average annual gain of 9.6%.
We will conduct the next quarterly review of the portfolio around the beginning of June. Any changes to the market-cap and valuation limits along with any portfolio additions or deletions will be announced at the time they are made in a special Model Shadow Stock Portfolio Update email (sign up at www.aaii.com/email).
Ampco-Pittsburgh Corporation (AP)
(03/20/2023)
Ampco-Pittsburgh reported a net loss for the fourth-quarter and full-year 2022. For the quarter, the company reported a net loss of $0.5 million, or $0.02 per diluted share. This compares to a net loss of $7.4 million, or $0.39 per diluted share in the prior-year quarter. For the year, it reported a net loss of $3.4 million, or $0.18 per diluted share. This compares to a net loss of $3.9 million, or $0.20 per diluted share for full-year 2021.
Net sales were up in the fourth quarter to $93.5 million, compared to $84.5 million in the prior-year quarter. For the full year, net sales were $390.2 million, compared to $344.9 million for full-year 2021.
Ampco-Pittsburgh reported income from operations for the quarter of $0.9 million, compared to a loss from operations of $7.7 million in the prior-year quarter. For the full year, income from operations was $2.8 million, compared to loss from operations for full-year 2021 of $4.8 million.
(03/21/2023)
Ducommun announced that it entered into a definitive purchase agreement to acquire BLR Aerospace LLC. BLR Aerospace is a leading provider of proprietary aerodynamic systems that enhance the productivity, performance and safety of rotary and fixed-wing aircraft. The transaction is subject to customary closing conditions and regulatory approval. It is expected to be completed during the second quarter of 2023.
(04/13/2023)
A Nebraska jury rendered a unanimous verdict against Wright Printing Co., its owner Mark Wright and CEO Mardra Sikora for a total of $5 million in damages. The lawsuit was filed by Crabar/GBF Inc., a subsidiary of Ennis, which purchased Wright Printing’s folder businesses for $15 million in 2013. As part of the 2013 purchase, the Ennis subsidiary leased the manufacturing building from a separate company controlled by Mark Wright. Ennis alleged in its lawsuit that less than two years after the purchase, Wright informed Ennis on short notice that he was selling the building and would not allow Ennis to extend its lease. Ennis was forced to relocate the folder businesses to an Ennis-owned facility in Columbus, Kansas, and train a new workforce.
(03/29/2023)
Ennis announced a quarterly cash dividend of $0.25 per share, in line with its previous declaration. The dividend is payable on May 8 to shareholders of record on April 17.
Friedman Industries, Incorporated (FRD)
(03/21/2023)
Friedman Industries declared a cash dividend of $0.02 per share on its common stock. The dividend is payable on May 26 to shareholders of record at the close of business on April 28. This dividend marks the company’s 205th consecutive quarterly cash dividend since becoming publicly traded in 1972.
(04/03/2023)
Rocky Brands announced the sale of its Sevrus brand to PQ Footwear LLC, a subsidiary of Industrias PetroQuim SA. The transaction officially closed on March 30, 2023. The proceeds of the transaction were used to pay down debt. Terms of the transaction were not disclosed.
(03/16/2023)
Titan Machinery reported fiscal fourth-quarter and full-year 2022 financial results. Revenue increased 14.9% in the fourth quarter to $583.0 million. Full-year revenue was $2.21 billion, reflecting a 29.1% increase from last year. Full-year net income increased 52.6% to $102.6 million. The company reported earnings of $0.81 per share, 28.6% below the I/B/E/S consensus estimate of $1.134 per share.
 Get updates about the portfolio that has outperformed the market by 211.9%
since inception!
Get updates about the portfolio that has outperformed the market by 211.9%
since inception!