

John Bajkowski
is the president of AAII.
 AP
BSET
BZH
DFSCX
EBF
FRD
HOFT
HURC
KE
KTCC
MG
NAESX
NC
PANL
RCKY
STRT
TITN
VFINX
AP
BSET
BZH
DFSCX
EBF
FRD
HOFT
HURC
KE
KTCC
MG
NAESX
NC
PANL
RCKY
STRT
TITN
VFINX
The stock market returns were mixed during April, with larger companies typically outperforming smaller companies, but the relative performance of growth versus value companies varied across the market-capitalization segments. We’re in a pause as investors await the resolution of the impending federal debt ceiling while digesting first-quarter earnings reports. The Model Shadow Stock Portfolio gained 0.4% during April, preserving its 8.5% return year to date. The S&P 500 index, as measured by the performance of the Vanguard 500 Index fund  (VFINX), was up 1.6% during the month, boosting its 2023 return to 9.1% through the end of April. The Vanguard Small Cap Index fund (NAESX) lost 1.2% during April, dropping its year-to-date return to 2.5%. The DFA U.S. Micro Cap fund (DFSCX) declined 3.1% during April and is now down 0.4% for the year.
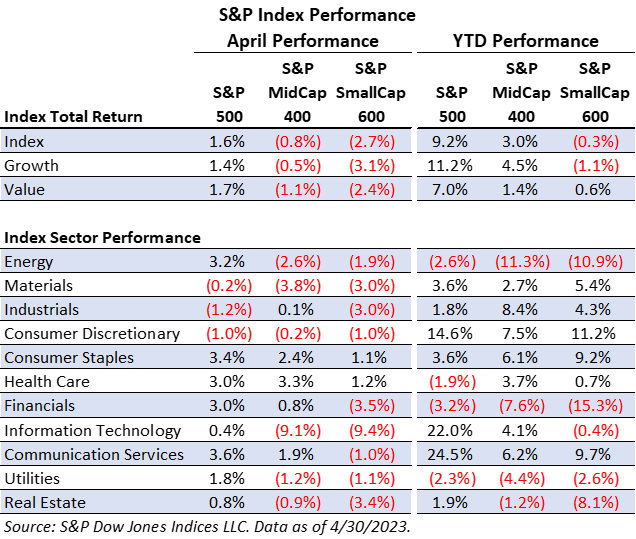
In the large-cap segment, growth stocks were up 1.4% during April and are now up 11.2% for the year. Large-cap value stocks were up 1.7% during April, boosting their year-to-date return to 7.0%.
In the mid-cap segment, growth stocks declined 0.5% during April, reducing their year-to-date return to 4.5%. Mid-cap value stocks fell 1.1% during the month and are now up just 1.4% for the first four months of the year.
Small-cap growth stocks exhibited the greatest decline during April, dropping 3.1% and moving into the red for the year with a return of –1.1% through April. Small-cap value stocks lost 2.4% during April, reducing their year-to-date return to just 0.6%.
Sector performance can vary widely across market-cap sizes, with stronger relative performance generally seen by larger companies. Building upon the sector performance table we presented last month, we added a section for year-to-date performance and the performance of the S&P growth and value indexes.
The top-performing sectors during April within the large-cap segment were communication services (+3.6%), consumer staples (+3.4%) and energy (+3.2%). Within the S&P SmallCap 600 index, the best-performing sectors were health care (+1.2%), consumer staples (+1.1%) and consumer discretionary (–1.0%). Only two of the sectors with the S&P SmallCap 600 had positive returns during April.
The weakest sectors within the S&P 500 during April were industrials (–1.2%), consumer discretionary (–1.0%) and materials (–0.2%). Within the S&P SmallCap 600, the weakest sectors during the month were information technology (–9.4%), financials (–3.5%) and real estate (–3.4%).
The theme seems to be that under the current uncertain economic environment, investors are more comfortable investing in larger companies that are somewhat less sensitive to an economic downturn.
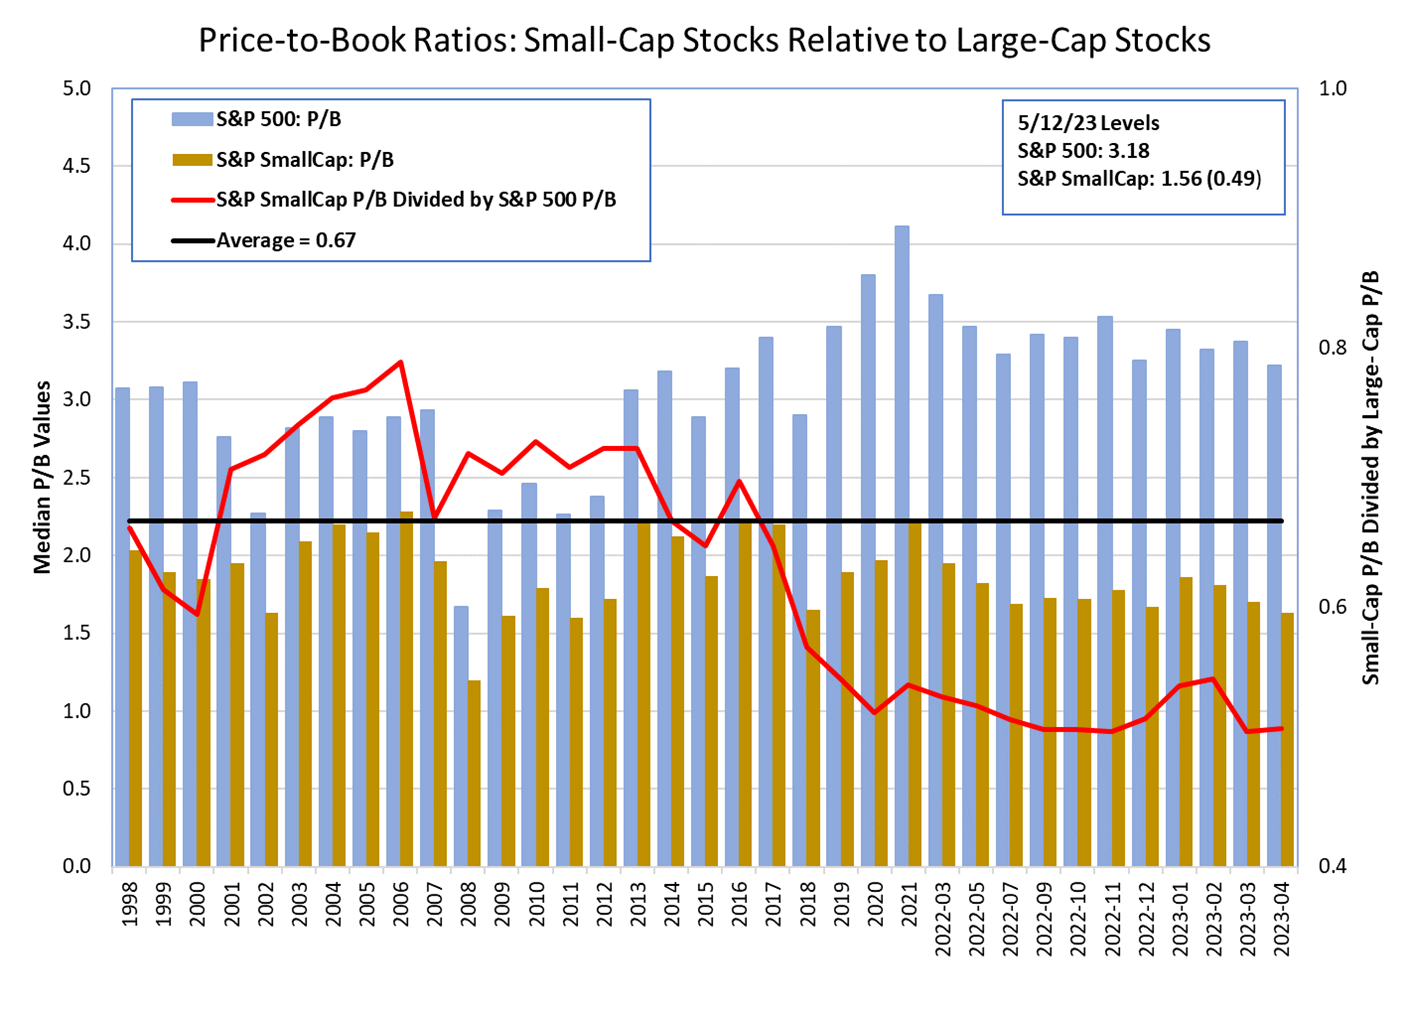
We see that this preference for large-cap stocks is reflected in the relative valuation levels. The median price-to-book-value (P/B) ratio of the companies in the S&P SmallCap 600 is 1.56, more than half of the 3.18 median ratio for the companies in the S&P 500. The S&P SmallCap 600 normally trades at a discounted multiple relative to the S&P 500. The discount has averaged 0.67 since 1998. The difference was smallest during 2006 when the discount was only 0.79 times (2.28 compared to 2.89) and has been around 0.50 since 2020. Toward the end of 2022 and at the start of 2023, small caps were outperforming large caps and the valuation gap tightened, but the regional banking crisis seemed to shift investor preferences back toward larger companies.
Since its inception in 1993, the AAII Model Shadow Stock Portfolio has a compound annual average return of 13.7% versus the Vanguard 500 Index fund’s gain of 9.7% per year on average over the same period. Over the same period, the Vanguard Small Cap Index fund posted an average annual gain of 9.5%.
Within the Model Shadow Stock Portfolio, the best-performing stocks in April were Beazer Homes USA Inc. (BZH), up 34.2%; Rocky Brands Inc. (RCKY), up 26.7%; Ampco-Pittsburgh Corp. (AP), up 23.3%; and Mistras Group Inc. (MG) up 19.8%.
The weakest-performing stocks for the month were Bassett Furniture Industries Inc. (BSET), down 19.4%; Kimball Electronics Inc. (KE), down 16.5%; Strattec Security Corp. (STRT), down 14.7%; and Hooker Furnishings Corp. (HOFT), down 13.1%.
Any noteworthy news on the Model Shadow Stock Portfolio holdings is below. We are archiving news items on the holdings. The archives can be accessed from news column of the Model Shadow Stock Portfolio tab of the Shadow Stock website.

Twenty-seven stocks met the initial selection criteria for the Model Shadow Stock Portfolio as of May 12, 2023, up from 25 passing stocks one month ago. AAII members can see and research which companies are currently passing the initial selection criteria in the Shadow Stock Ideas table on AAII.com. The list of new Shadow Stock Ideas is updated daily—Tuesday through Saturday.
Of the 27 qualifying companies, seven are currently held in the Model Shadow Stock Portfolio: Bassett Furniture Industries, Fonar Corp. (FONR), Friedman Industries Inc. (FRD), Hurco Companies Inc. (HURC), Key Tronic Corp. (KTCC), NACCO Industries Inc. (NC) and Pangaea Logistics Solutions Ltd. (PANL). Qualifying companies are those held in the Model Shadow Stock Portfolio that currently meet the initial purchase rules. (They are designated as “currently qualifies” in the notes column of the Model Shadow Stock Portfolio table on AAII.com. However, if you go online, the notes may not match the list discussed here since the notes on the website table are dynamically updated daily.)
Big 5 Sporting Goods Corp. (BGFV) came off the qualifying list when its consensus earnings estimate for the current quarter turned negative. Qualifying companies must have positive historical earnings for the most recent quarter and trailing 12 months. If they have consensus earnings estimates, they must be positive for the current quarter and fiscal year.
Hooker Furnishings came off the qualifying list when it reported negative GAAP earnings for its most recent quarter that were weak enough to push its trailing 12-month GAAP earnings into the red as well. The company took a noncash inventory write-down for the quarter as it decided to exit a line of business that lowered its margins. The normalized earnings, as calculated by our data vendor Refinitiv, are $0.083 per share, compared to a loss of $1.591 per share for the latest quarter. That is why the company has a “TTM adjusted earnings positive” note online.
Rocky Brands also came off the qualifying list after reporting negative GAAP earnings last quarter. The company also has a negative consensus earnings estimate for the current quarter.
As of May 12, 2023, Ennis Inc. (EBF) had the highest price-to-book ratio in the Model Shadow Stock Portfolio. Its ratio of 1.61 is above the 0.90 maximum value used for initially qualifying a stock for inclusion in the portfolio. However, stocks are not removed from the portfolio until their price-to-book ratio rises to three times the initial maximum value (2.70).
Titan Machinery Inc. (TITN) had the highest market cap in the portfolio, with a value of $745.9 million as of May 12, 2023. The Model Shadow Stock Portfolio looks for stocks with a market cap (share price times shares outstanding) greater than $30 million but less than $300 million when adding stocks to the portfolio. Shadow stocks with a market cap three times the initial market-cap maximum ($300 million × 3 = $900 million) at the time of a quarterly review are removed from the portfolio, assuming there is a suitable replacement.
Click here to see the current addition and deletion rules for the portfolio.
The next quarterly review of the AAII Model Shadow Stock Portfolio will take place around the beginning of June 2023, after most of the holdings have announced their quarterly earnings. Any changes to the portfolio will be announced at the time they are made in a special Model Shadow Stock Portfolio Update email (sign up at www.aaii.com/email).
Ampco-Pittsburgh Corporation (AP)
(05/15/2023)
Ampco-Pittsburgh reported its financial results for the first quarter of fiscal-year 2023. The company reported diluted earnings per share of $0.03, with net income of $676,000. Revenue totaled $104.8 million, an 11% increase from the same period of 2022. Income from operations for the quarter totaled $1.9 million, compared to a loss from operations of $453,000 in the first quarter of 2022.
(05/09/2023)
Advanced Emissions Solutions reported a first-quarter loss per diluted share of $0.32, compared to the I/B/E/S consensus estimate for a loss of $0.10 per share. Revenue was $20.8 million, representing a 21.2% decrease from the same period a year prior. The company reported an operating loss of $7.8 million, compared to an operating loss of $3.3 million in the first quarter of 2022. Net loss for the quarter was $7.5 million, compared to a net loss of $3.03 million in the comparable period of 2022.
CEO Greg Marken said, “Our first-quarter consumables revenue was below our expectations, as cheap alternative fuel sources such as natural gas pressured our Power Generation customers, which was partially offset by our ongoing price initiatives and commercial wins in other end markets. We continue to make good progress on our inventory position and look forward to continuing to pursue more economically attractive opportunities that may result through additional positive price/mix changes during the remainder of the year.”
(04/27/2023)
Beazer Homes reported second-quarter 2023 earnings per diluted share of $1.13, beating the I/B/E/S consensus estimate of $0.82 per share by 38%. Net income declined compared to the second quarter of 2022, down 22.3% from $44.6 million to $34.7 million.
Revenue for the quarter totaled $543.9 million, an increase in comparable periods of 7.0%. Gross profit declined 14.1%, down to $102.8 million from $119.8 million in the comparable period of 2022. Operating income also declined, down 29.0% from $53.6 million to $38.8 million.
CEO Allan P. Merrill said, “While home affordability remains quite challenging, homebuyers appear to be adjusting to a higher interest rate environment aided by both wage growth and moderating home prices. From a production perspective, supply chain issues are greatly improved, allowing us to decrease cycle times and pursue direct cost savings.”
Big 5 Sporting Goods Corporation (BGFV)
(05/02/2023)
Big 5 Sporting Goods reported first-quarter non-GAAP earnings per share of $0.01, compared to the I/B/E/S consensus estimate of $0.03 per share. Revenue was $224.9 million, representing a 7.0% decrease from the same period one year prior. The company reported earnings before interest, taxes, depreciation and amortization (EBITDA) of $4.5 million, compared to $15.0 million in the prior-year period.
CEO Steven G. Miller stated, “As we begin the second quarter, the macro environment is continuing to pressure our customers’ discretionary spending. We remain focused on navigating the challenging conditions by driving healthy merchandise margins and managing our cost structure in an effort to offset inflationary pressures.”
(05/01/2023)
Clarus reported first-quarter non-GAAP earnings per share of $0.18, missing the I/B/E/S consensus estimate of $0.197 per share by 8.6%. Revenue totaled $97.4 million, representing a 14.0% decrease from the comparable period of 2022. Adjusted net income before non-cash items was $6.9 million, or $0.18 per diluted share, compared to $14.8 million, or $0.37 per diluted share, for the comparable period of last year.
“Clarus’ consolidated Q1 performance was resilient given the macroeconomic headwinds that carried over from 2022,” said executive chairman Warren Kanders. “Operationally, we enhanced our segment leadership to activate the next phase of our corporate and brand evolution. Our brand leaders are focused on establishing revenue, gross margin and EBITDA baselines, upgrading talent and further driving shareholder value through cash flow generation and debt paydown.”
(04/28/2023)
Clarus announced a regular quarterly dividend of $0.025 per share. The dividend is payable on May 19 to shareholders of record as of May 8. The stock will trade ex-dividend on Friday, May 5.
Core Molding Technologies, Inc. (CMT)
(05/09/2023)
Core Molding Technologies reported first-quarter earnings per diluted share of $0.66, beating the I/B/E/S consensus estimate of $0.37 per diluted share by 78.4%. Net sales were $99.5 million, up 9.8% from $90.6 million in the prior year, and gross margin was $17.7 million, or 17.8% of net sales, compared to $14.5 million or 16.0% of net sales one year ago. Operating income was $8.1 million, or 8.1% of net sales, versus operating income of $6.0 million, or 6.6% of net sales for the same period one year ago.
CEO David Duvall said, “We continue to diversify and transition our business to an engineered material and technical solution provider that delivers high-value solutions to our customers, which drives higher margins. We are seeing the benefit of our broad portfolio of processes and industries … Our technical solution strategy positions us well to take advantage of opportunities in various industries that are requiring new solutions, including opportunities resulting from government-funded infrastructure projects and sustainability improvements.”
Covenant Logistics Group, Inc. (CVLG)
(04/27/2023)
Covenant Logistics Group reported first-quarter 2023 adjusted earnings per diluted share of $0.93, beating the I/B/E/S consensus estimate of $0.81 per share by 12.9%. Net income for the quarter totaled $16.6 million, down 24.9% from one year ago. Total revenue for the quarter was $266.8 million, down 8.5% from $291.6 million in the same quarter one year ago. Operating profit for the quarter was $17.6 million, down 9.4% from $23.8 million one year ago.
CEO David R. Parker said, “The first quarter’s freight market, consisting of a combination of freight rates and volumes, has materially softened compared to a year ago and has remained soft throughout April. Despite these market headwinds, we are pleased with the resiliency in the first quarter’s profitability of our asset-based segments, consisting of expedited and dedicated. Our asset-light segments, consisting of managed freight and warehousing, experienced significant deterioration in margin compared to the prior-year quarter as a result of reductions in brokerage volumes and rates associated with overflow freight from our asset-based segments.”
(05/04/2023)
Ducommun reported first-quarter 2023 adjusted net income of $5.2 million, or $0.63 per diluted share, compared to the I/B/E/S consensus estimate of $0.60 per diluted share, representing a 5.5% surprise. This compares to adjusted net income of $8.3 million, or $0.67 per diluted share, for the first quarter of 2022. Net revenue was $181.2 million, up 11%, while net income declined to $5.2 million, or $0.42 per diluted share. Gross profit was $36.8 million, or 20.3% of revenue, compared to gross profit of $32.5 million, or 19.9% of revenue, for the first quarter of 2022.
CEO Stephen Oswald stated, “We are off to a good start in 2023, with double-digit top-line growth, led by strong commercial aerospace demand and continued steady performance from our defense business.”
(04/25/2023)
Ducommun completed its acquisition of BLR Aerospace LLC.
Chairman, president and CEO Stephen G. Oswald said, “BLR’s product offerings further strengthen our engineered products portfolio at the company and adds as well very important aftermarket business.”
(04/24/2023)
Ennis reported fourth-quarter earnings per diluted share of $0.47; for the full year, earnings per diluted share totaled $1.82.
Total revenue for the year was $431.8 million, up 8.0% over $400 million in 2021. Operating income for 2022 totaled $66.1 million, up 51.8% over $43.5 million in 2021. Total net income for 2022 was $47.3 million, a 63.2% increase over $28.9 million in 2021.
CEO Keith Walters commented, “We believe we have one of the strongest balance sheets in the industry, with no debt and significant cash. Our profitability and strong financial condition will allow us to continue operations and fund acquisitions without incurring debt. Given those strengths, we also anticipate timely access to credit should larger acquisition opportunities materialize as we continue to explore strategic opportunities in the acquisition arena to increase profitability.”
(05/09/2023)
Escalade reported a net loss of $1.0 million for first-quarter 2023, a $0.07 loss per diluted share compared to earnings of $0.49 per share for the first quarter of 2022. Sales declined 21.3%, down to $56.9 million from $72.4 million one year ago. The company cited a combination of changing post-pandemic consumer demand and unfavorable weather conditions that delayed the start of spring business. Operating income also declined, down to $0.1 million, a 98.3% decline year over year. The company’s earnings before interest, taxes, depreciation and amortization (EBITDA) totaled $1.6 million, down 85.2% from $10.5 million in the same quarter one year ago.
CEO Walter P. Glazer Jr. stated, “While sales volumes declined across most categories in the period given a challenging prior-year comparison, we continued to maintain price discipline, consistent without strategic focus. Entering the second quarter, we anticipate wholesale restocking to gradually increase as we move into the warmer, summer months and the second half of the year.”
(04/25/2023)
A formal partnership for 2023 National Pickleball amateur tournaments was announced by National Pickleball and ONIX Pickleball. Escalade will continue to supply the official ball of all National Pickleball tournaments, the Dura Fast-40.
(05/15/2023)
Fonar reported financial results for third-quarter 2023. The company had diluted net income per share of $0.56, compared to $0.33 per share in the same period of 2022. Net income increased 37% to $4.5 million over the third quarter of 2022. The company reported total revenue of $25.4 million, up 3% from $25.4 million reported in the prior-year period. Income from operations for the third quarter decreased 26% from $5.6 million to $4.2 million year over year.
(05/10/2023)
Global Ship Lease reported first-quarter 2023 net income of $72.2 million, an increase of 6.5% from the first quarter of 2022. Adjusted earnings per share were $2.12, 4.2% above the I/B/E/S consensus estimate of $2.04 per share.
CEO Ian Webber stated, “By remaining disciplined, aggressively deleveraging and continually identifying opportunities to reduce our cost of debt, including hedging our interest rate exposure, and enhance our overall financial flexibility, GSL is entering a new phase of the cycle with both good forward visibility on cash flows and a robust balance sheet.”
Hooker Furnishings Corporation (HOFT)
(04/14/2023)
Hooker Furnishings released fourth-quarter and full-year 2023 results. The company reported a diluted loss of $1.60 per share for the quarter and a loss of $0.37 per share for the year. Hooker Furnishings had a loss on the year due to a major change in inventory valuation during the fourth quarter of 2023.
Hooker Furnishings took a $24.4 million noncash charge for the write-down of inventories related to its exit from the Accentrics Home (ACH) line of lower-priced items in the Home Meridian segment. As a result, Hooker Furnishings reported a consolidated operating loss of $6.0 million and a consolidated net loss of $4.3 million for fiscal-year 2023, compared to consolidated operating income of $14.8 million and consolidated net income of $11.7 million in the prior year.
(05/02/2023)
Key Tronic reported earnings per diluted share of $0.18 for its fiscal-2023 third quarter, compared to $0.09 per share in the same period of 2022.
Total revenue was $164.6 million, up 19% from $138.4 million in the same period of fiscal-year 2022. Gross margin was 8.7% and operating margin was 3.1%, up from a gross margin of 8.3% and an operating margin of 2.0% in the same period of fiscal-year 2022. Net income was $2.0 million, or $0.18 per share, up 100% from $1.0 million, or $0.09 per share, for the same period of fiscal-year 2022.
Kimball Electronics, Inc. (KE)
(05/04/2023)
Kimball Electronics reported adjusted earnings per diluted share of $0.65 for its fiscal-2023 third quarter, missing the I/B/E/S consensus estimate of $0.68 per share by 4.4%. Net sales totaled $484.7 million, an all-time quarterly high and up 32% year over year; foreign currency had a 2% unfavorable impact on net sales compared to the third quarter of fiscal 2022. Operating income was $25.2 million, or 5.2% of net sales, compared to $20.3 million, or 5.5% of net sales, in the same period last year. Adjusted operating income was $25.6 million, or 5.3% of net sales, compared to $19.6 million, or 5.3% of net sales, in the same period last year.
Lazydays Holdings, Inc. (GORV)
(04/27/2023)
Lazydays Holdings reported a loss per diluted share of $0.17 for the first quarter of 2023, a massive miss from the I/B/E/S consensus estimate for earnings of $0.143 per share.
Total revenue for the quarter was $295.6 million, a 21.4% decrease from the comparable period of 2022 with revenue of $376.1 million. Operating income declined 84.6% to $5.9 million and net income declined 101% to a loss of $276,000.
The first-quarter 2023 adjusted results exclude a net noncore charge of $0.17 per share related to the effects of changes in the fair value of warrant liabilities, last in, first out (LIFO) adjustment, acquisition expenses, certain severance and transition costs and an impairment charge related to internally developed software.
(05/03/2023)
Mistras reported a diluted loss per share of $0.12 for the first quarter, lower than the I/B/E/S consensus estimate for a loss of $0.05 per share. Total revenue increased 3.9% to $168.0 million from $161.7 million in the same period a year prior. Field services revenue increased by 4%, shop laboratories revenue increased by 0.03%, data solutions revenue increased by 35.6% and other revenue decreased by 7.5% from the prior-year quarter.
The company reaffirmed its guidance for 2023. Mistras expects its total revenue to be between $710 million to $740 million, with expected adjusted earnings before interest, taxes, depreciation and amortization (EBITDA) between $70 million and $75 million.
(05/03/2023)
NACCO Industries reported first-quarter earnings per diluted share of $0.76. Total revenue decreased 1.7% to $20.60 million from $20.96 million in the same period one year prior. Coal deliveries revenue decreased 2.7% and mineral management revenue decreased 35% compared to the same quarter one year prior.
Pangaea Logistics Solutions Ltd. (PANL)
(05/10/2023)
Pangaea Logistics Solutions reported first-quarter 2023 earnings per diluted share of $0.08, beating the I/B/E/S consensus estimate of $0.064 per diluted share by 25.0%. Total revenue for the quarter decreased 40% to $113.7 million from $191.7 million in the same period a year prior. Voyage revenue declined 38% and charter revenue decreased 64% compared to the same quarter one year ago. Net income decreased 85% to $ 3.4 million from $22.4 million in the first quarter of 2022. Total adjusted earnings before interest, taxes, depreciation and amortization (EBITDA) decreased 48% to $16.2 million in the first quarter, as seasonal demand weakness negatively impacted market rates.
“During a seasonally slower period for the global dry-bulk shipping market, we delivered an average TCE rate that was nearly 50% higher than market benchmark indices, resulting in another consecutive quarter of profitability,” stated CEO Mark Filanowski. “Looking ahead, we anticipate Pangaea will generate strong free cash flow this year, positioning us to further reward our shareholders, reduce debt outstanding and opportunistically refresh our existing fleet with newer, more efficient vessels, particularly given recently enacted emissions regulations.”
In addition, the company declared a quarterly cash dividend of $0.10 per share, payable on June 15, to shareholders of record as of June 1.
(04/26/2023)
Pangaea Logistics Solutions announced the acquisition of a dry-bulk vessel of 61,000 deadweight tons in the second-hand market for $26.6 million in cash. Built in 2014, the vessel is expected to be delivered to Pangaea Logistics in June 2023, representing the 25th owned vessel in its fleet. The vessel is currently expected to enter into service immediately after delivery. Between its owned and short-term chartered-in fleet, Pangaea Logistics currently operates 50 vessels in worldwide trades.
(05/03/2023)
Rocky Brands reported an adjusted diluted loss per share of $0.12 for the first quarter, compared to the I/B/E/S consensus estimate of $0.047 per share. Total revenue decreased 33.9% to $110.4 million from $167 million in the same period one year prior. Wholesale segment sales decreased 40.2%, retail segment revenue increased 3.1% and contract manufacturing sales decreased 80% compared to the same quarter one year prior.
Strattec Security Corporation (STRT)
(04/27/2023)
Strattec Security reported a loss per diluted share of $0.57 for its third fiscal quarter of 2023, missing the I/B/E/S consensus estimate for a loss of $0.23 per share by 147.8%.
Total revenue for the quarter increased 9.7% to $127.2 million from $115.9 million in the third quarter of 2022. The company reported an operating loss of $2.5 million, a 173.6% decrease from the same quarter a year ago. Net income declined 179.5%, from $4.1 million for the previous year’s third quarter to a loss of $3.3 million.
CEO Frank Krejci said, “This quarter has proved to be another challenging one. Although shipping volumes improved from the previous quarter and we began to see modest relief in the cost of raw materials, the inflationary pressure from our suppliers continued to escalate … Additionally, effective January 1 we began to feel the impact of a significant government mandated wage increase in Mexico. And while the U.S. dollar remained strong in much of the world, it has continued to weaken against the Mexican peso, which put further pressure on our profitability. As we look to the near future, the team is hard at work preparing the launch of new business with more favorable margins, and we continue to find ways to improve operational efficiencies, including vertical integration opportunities. We expect both to benefit our bottom line in the short and the long term.”
Vishay Precision Group, Inc. (VPG)
(05/09/2023)
Vishay Precision Group reported adjusted earnings per diluted share of $0.52 for the first quarter, missing the I/B/E/S consensus estimate of $0.536 per share by 3.0%. Total revenue for the quarter was $88.9 million, a 1.4% increase over the comparable period of 2022. Gross profit margin improved to 41.9% compared to 40.2% in the prior year’s first quarter. Operating margin increased to 11.2% from 9.5% one year ago. Adjusted net income was $7.0 million compared to $6.6 million one year ago, representing a 7.9% net margin for the first quarter of 2023.
CEO Ziv Shoshani said, “Our strong balance sheet and cash generation support our ongoing strategic initiatives aimed at capturing a broader set of opportunities for our sensing and precision measurement technologies, while maintaining tight control of our costs and increasing our operating efficiencies.”
VOXX International Corporation (VOXX)
(05/15/2023)
VOXX International announced fourth-quarter and full-year fiscal-2023 financial results. The company reported a fourth-quarter net loss per diluted share of $0.80, well under the I/B/E/S consensus estimate for a loss of $0.22 per share.
Total revenue for full-year 2023 decreased 19% from $635.9 million to $534 million year over year. The company reported an operating loss for 2023 of $27.3 million, compared to operating profit of $7.9 million in 2022. The net loss for the year was $29.8 million, compared to a net loss of $24.9 million in 2022.
(05/01/2023)
VSE Corp. reported first-quarter 2023 adjusted earnings per diluted share of $0.83, beating the I/B/E/S consensus estimate of $0.56 per share by 48.2%. Revenue was $255.4 million, a 10.5% increase from $231.24 million in the same period one year prior. Aviation segment revenue increased 21.4%, fleet segment revenue increased 12.4% and federal and defense revenue decreased 5.7% compared to the same quarter one year prior. Net income was $9.1 million, an increase of 46% from $6.2 million in the first quarter of 2022.
 Get updates about the portfolio that has outperformed the market by 211.9%
since inception!
Get updates about the portfolio that has outperformed the market by 211.9%
since inception!