

John Bajkowski
is the president of AAII.
 BSET
BZH
CLAR
CMT
DFSCX
FRD
HURC
KTCC
LAKE
MG
NAESX
NC
PANL
RCKY
STRT
VFINX
BSET
BZH
CLAR
CMT
DFSCX
FRD
HURC
KTCC
LAKE
MG
NAESX
NC
PANL
RCKY
STRT
VFINX
The market continued its strong performance during July, with the Model Shadow Stock Portfolio gaining 8.7% for the month, boosting its year-to-date performance to 23.6%. Investors cheered the resilient domestic economy and slowing rate of inflation growth. The S&P 500 index was up 3.2% for the month and is now up 20.6% for the year.
Smaller companies led the market during July but still have some catching up to do to surpass the S&P 500 for the year. The S&P MidCap 400 index was up 4.1% during July and is now up 13.3% for the year, while the S&P SmallCap 600 index gained 5.5% during the month and is up 11.9% year to date. The Vanguard Small-Cap Index fund  (NAESX) was up 4.9% during the month and has a year-to-date performance of –14.6%, while the DFA U.S. Micro Cap fund (DFSCX) was up 5.8% during July and is up 12.8% for the first seven months of this year.
Since its inception in 1993, the AAII Model Shadow Stock Portfolio has a compound annual average return of 14.0%, versus the Vanguard 500 Index fund’s (VFINX) gain of 10.0% per year on average over the same period. Over the same period, the Vanguard Small-Cap Index fund posted an average annual gain of 9.8%.
The performance of growth- versus value-oriented stocks was slanted toward value stocks during the month. In the large-cap segment, value stocks were up 3.4% for the month, boosting their year-to-date return to 16.0% for 2023. Large-cap growth stocks remain stronger year to date with a 24.9% gain after adding 3.1% during July.
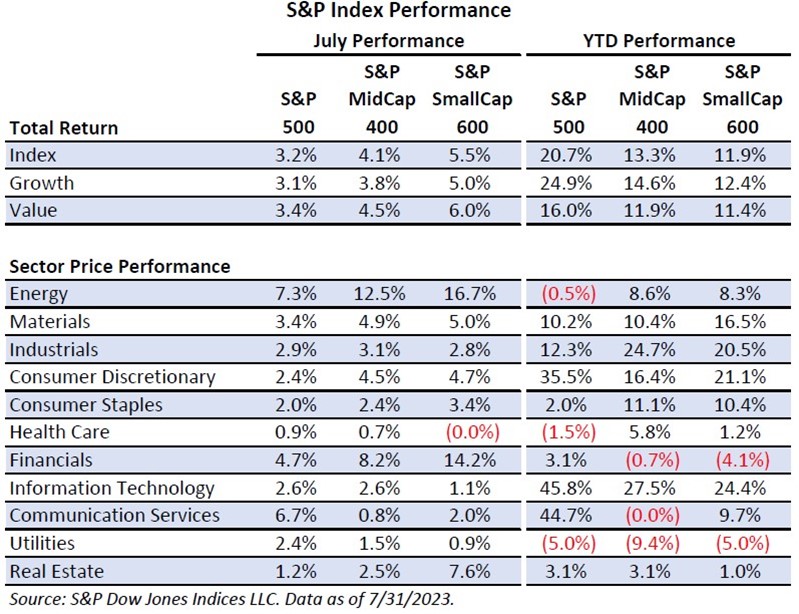
In the mid-cap segment, value stocks are up 11.9% for the year, after gaining 4.5% during July. Mid-cap growth stocks are up 14.6% for the year, after gaining 3.8% during the month.
Small-cap value stocks are up 11.4% year to date, while small-cap growth stocks are up 12.4%. During July, small-cap value stocks gained 6.0% and small-cap growth stocks gained 5.0%.
All of the sectors posted gains during July in the large-cap segment, led by energy, which was up 7.3% during the month as energy prices trended up. Energy is one of three large-cap sectors that is still down for the year. The top-performing sectors during July within the large-cap segment were energy (+7.3%), communication services (+6.7%) and financials (+4.7%). Within the S&P SmallCap 600, energy was also the best-performing sector during July, up 16.7%. The other strong sectors included financials (+14.2%) and real estate (+7.6%).
The weakest sectors within the S&P 500 during June were health care (+0.9%), real estate (+1.2%) and consumer staples (+2.0%). Within the S&P SmallCap 600, the weakest sectors during the month were health care (–0.0%), utilities (–0.9%) and information technology (+1.1%).
Within the S&P 500, information technology (+45.8%), communication services (+44.7%) and consumer discretionary (+35.5%) are leading this year, while utilities (–5.0%), health care (–1.5%) and energy (–0.5%) are lagging this year.
With the sharp market movements and changing economic picture, we thought it might be helpful to present an updated view of the valuations and performance of market segments and sectors. We used AAII’s Stock Investor Pro fundamental stock screening and research database to capture the data and present it with a color gradient to more easily spot trends and patterns across the various segments.
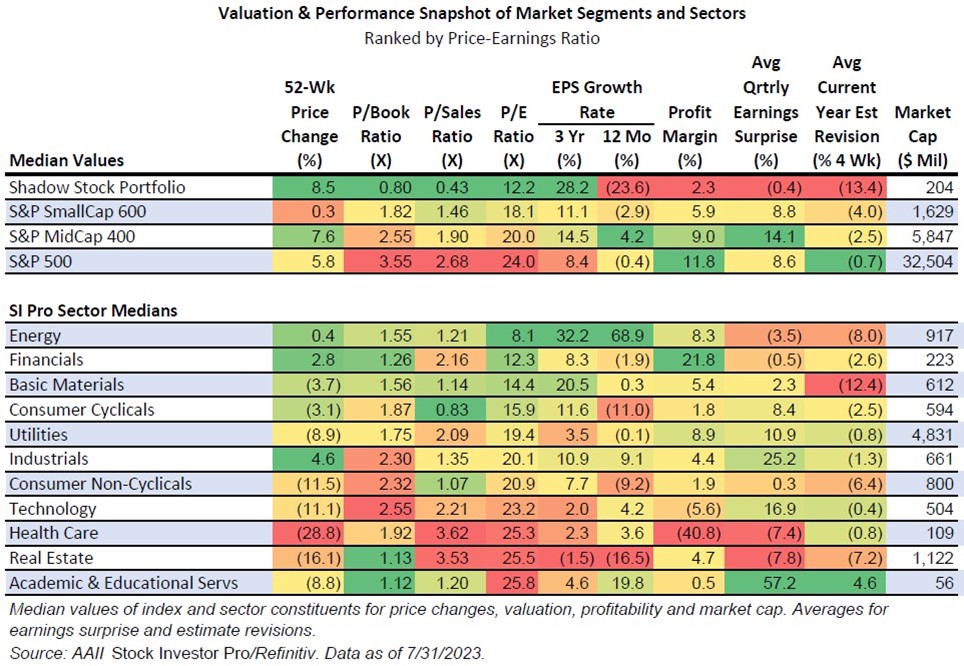
The top portion of the table examines the constituents of the S&P market-capitalization groupings, as well as the current Model Shadow Stock Portfolio. The lower portion of the table examines the stocks within the 11 sectors used by Refinitiv to provide broad sector groupings within Stock Investor Pro. Each section is ranked by the median price-earnings (P/E) ratio of the stocks that make up each index or sector.
Looking at valuation, larger companies continue to trade with significantly higher multiples of book value, sales or earnings compared to smaller-cap stocks. The median price-earnings ratio is 24.0 for the stocks in the S&P 500 compared to 18.1 for stocks in the S&P SmallCap 600 and 12.2 for stocks in the Model Shadow Stock Portfolio. Stocks normally trade with higher price-earnings ratios if investors anticipate higher future earnings growth as well as greater certainty (lower risk) of achieving growth. Smaller-company stocks normally trade at a discount to larger firms because of their greater risk and lower liquidity, but currently they continue to be more attractively priced.
It is interesting that the historical three-year earnings growth rates are generally greater for the smaller firms, but the profitability is higher for the larger firms within the S&P 500. The strongest earnings surprises have come within the S&P MidCap 400 index, but the greatest downward revisions are found among the smaller companies.
Among the 11 sectors within Stock Investor Pro, mainly cyclical stocks are trading with more attractive valuations. One consideration to keep in mind when looking at price-earnings ratios is that cyclical stocks often exhibit low price-earnings ratios near the end of an economic expansion if investors anticipate a slowdown in profits going forward. The trailing price-earnings ratio relates share price to recent historical company performance. It is helpful to use a range of relevant valuation ratios and consider future prospects when making an investment evaluation.
Industrial stocks have the strongest 52-week price gains (+4.6%), while health care stocks as group have the weakest one-year price performance (–28.8%). They also continue to be among the most expensive.
The strongest historical earnings growth over the last three years and trailing 12 months is seen within the energy sector, while real estate has the weakest.
Financials have the strongest profit margins (+21.8%), while health care stocks have the weakest (–40.8%). The only other sector with negative profit margins, on average, is the technology sector (–5.6%).
The strongest positive earnings surprises have come within the academic and educational services sector (+57.2%) followed by industrials (+25.2%). The biggest negative earnings surprises are found within the real estate (–7.8%) and health care (–7.4%) sectors.
Basic materials had the largest downward earnings estimate revisions over the last month for the current fiscal year (–12.4%). All sectors have seen downward revisions in current earnings estimates over the last month except for the stocks in the academic and educational services sector, which have an average increase of 4.6%.
As a whole, stock prices have generally been climbing a wall of worry this year with investors focused on the risk of recession potentially accelerated by the attempts by the Federal Reserve to rein in inflation.
Twenty-three stocks met the initial selection criteria for the Model Shadow Stock Portfolio as of August 14, 2023, down from 24 passing stocks one month ago. AAII members can see and research which companies are currently passing the initial selection criteria in the Shadow Stock Ideas table on AAII.com. The list of Shadow Stock Ideas is updated daily, Tuesday through Saturday.
Of the 23 qualifying companies, eight were held in the Model Shadow Stock tracking portfolio at the time: Bassett Furniture Industries Inc. (BSET), Fonar Corp. (FONR), Hurco Companies Inc. (HURC), Key Tronic Corp. (KTCC), Lakeland Industries Inc. (LAKE), Mistras Group Inc. (MG), NACCO Industries Inc. (NC) and Pangaea Logistics Solutions Ltd. (PANL).
Lakeland Industries, Mistras Group and Pangaea Logistics Solutions were additions to the passing list this month. All of them saw their price-to-book-value (P/B) ratios drop into the currently qualifying range.
Big 5 Sporting Goods Corp. (BGFV) lost its currently qualifying label because it reported negative earnings per share last quarter. Friedman Industries Inc.’s (FRD) price-to-book ratio advanced to 1.08 over the last month.
As of August 14, Core Molding Technologies Inc. (CMT) had the highest price-to-book ratio in the Model Shadow Stock Portfolio. Its price-to-book ratio of 1.83 remains well below the threshold for removing a stock. Shadow stocks with a price-to-book ratio three times the initial maximum (0.90 × 3 = 2.70) at the time of a quarterly review are removed from the portfolio, assuming there is a suitable replacement.
Beazer Homes USA Inc. (BZH) had the highest market-cap value of $1.02 billion as of August 14. The Model Shadow Stock Portfolio looks for stocks with a market cap (share price times shares outstanding) greater than $30 million but less than $300 million when adding stocks to the portfolio. Shadow stocks with a market cap three times the initial market cap maximum ($300 million × 3 = $900 million) at the time of a quarterly review are removed from the portfolio, assuming there is a suitable replacement. Beazer Homes is above the portfolio’s size limit. We will first review the decile market cap and price-to-book limits at the end of this month to see if any changes should be made to the cutoffs. Click here to see the current addition and deletion rules for the portfolio.
Within the Model Shadow Stock Portfolio, the best-performing stocks in July were SigmaTron International Inc. (SGMA), up 84.0%; Friedman Industries, up 41.2%; and Strattec Security Corp. (STRT), up 28.9%.
The weakest-performing stocks for the month were VOXX International Corp. (VOXX), down 26.0%; Rocky Brands Inc. (RCKY), down 4.2%; and Clarus Corp. (CLAR), down 2.6%.
As is often the case, the some the best-performing stocks one month become the weakest the next month, and some of the weakest performers become the strongest.
Any noteworthy news on the Model Shadow Stock Portfolio holdings is below. We are archiving news items on the holdings. The archives can be accessed from the news column of the Model Shadow Stock Portfolio tab of the Shadow Stock website.
The next quarterly review of the AAII Model Shadow Stock Portfolio will take place around the beginning of September 2023, after most of the holdings have announced their quarterly earnings. Any changes to the portfolio will be announced at the time they are made in a special Model Shadow Stock Portfolio Update email (sign up at www.aaii.com/email).
Ampco-Pittsburgh Corporation (AP)
(08/08/2023)
Ampco-Pittsburgh reported second-quarter 2023 earnings per diluted share of $0.02, with net income of $423,000. This compares to earnings per diluted share of $0.14 and net income of $2.8 million in the prior-year quarter. Total sales increased 4.5% from $102.6 million in second-quarter 2022 to $107.2 million. Operating income for the quarter totaled $3.3 million, up from $2.1 million in the prior-year period. Net income attributable to noncontrolling interest was $573,000, up from $119,000 in the second quarter of 2022.
CEO Brett McBrayer commented, “The air and liquid segment led the way in sales growth for both the quarter and year-to-date, and its order intake continues to set new records in air and liquid segment backlog, which increased 43% compared to a year ago and 14% sequentially. Despite some higher operating costs in the forged and cast engineered products segment and lower demand in the oil and gas and steel distribution markets for forged products, roll demand on balance has remained solid and pricing has kept pace with material and energy costs. Year-to-date consolidated operating income is more than three times last year’s level.”
(07/27/2023)
Beazer Homes reported third-quarter GAAP earnings per share of $1.42, beating the I/B/E/S consensus estimate of $0.88 per share. Second-quarter 2023 total revenue increased 8.7% from the prior-year quarter to $572.54 million. Much of this revenue came from homebuilding revenue of $570.5 million, a 9.0% increase over the same period of 2022.
Big 5 Sporting Goods Corporation (BGFV)
(08/01/2023)
Big 5 Sporting Goods reported a second-quarter GAAP loss per share of $0.01, beating the I/B/E/S consensus estimate for a loss of $0.03 per share. Second-quarter 2023 total revenue decreased 11.9% from the prior-year quarter to $223.57 million. The company also reported that same-store sales decreased 12.0% for the second quarter of fiscal 2023 compared to the same quarter one year ago. Earnings before interest, taxes, depreciation and amortization (EBITDA) were $4.2 million compared to adjusted EBITDA of $17.7 million in the prior-year period.
(08/07/2023)
Clarus reported second-quarter adjusted earnings per share of $0.11, compared to $0.33 in the second quarter of 2022 and missing the I/B/E/S consensus estimate of $0.13 per share by 15.4%.The company reported a net loss on a GAAP basis of $2.1 million, versus net income of $3.8 million one year ago. Sales totaled $83.7 million compared to $114.9 million in the second quarter of 2022, with the company reporting a gross margin of 36.7% versus 38.0% in the prior-year quarter. Clarus had an operating loss of $241,000, versus operating income of $7.8 million one year ago. Contributing to the loss were restructuring charges of $736,000 in the quarter.
“Our second-quarter results were impacted by the continued challenging macroeconomic environment and related headwinds,” said chairman Warren Kanders. “Specifically, a more promotional retail environment and inventory de-stocking headwinds impacted our sales velocity and our ability to protect margins. Despite these challenging market conditions, each segment generated positive free cash flow during the second quarter.”
Looking forward, Clarus expects full-year 2023 sales in the range of $385 million to $400 million and adjusted earnings before interest, taxes, depreciation and amortization (EBITDA) of $42 million to $50 million. Additionally, capital expenditures are expected to range between $6.5 million to $7.5 million and free cash flow is forecast to range between $30 million to $35 million.
(08/03/2023)
Clarus declared a quarterly dividend of $0.025 per share, in line with the previous payment. The dividend is payable on August 25, to shareholders of record as of August 14. The stock will trade ex-dividend on Friday, August 11. Clarus’ current dividend yield is 1.2%.
Core Molding Technologies, Inc. (CMT)
(08/08/2023)
Core Molding Technologies reported second-quarter 2023 earnings per share of $0.91, beating the I/B/E/S consensus estimate of $0.42 per share by over 100%. Net income for the quarter was $7.9 million compared to $2.9 million one year ago. Sales stayed at relatively the same level, with net sales of $97.7 million, compared to $98.7 million in the prior year. Gross margin was $20.6 million, or 21.0% of net sales, compared to $13.0 million, or 13.2% of net sales, one year ago. Improvement in 2023 was due to improved customer pricing and operational efficiencies. Operating income for the quarter was $10.1 million, or 10.3% of net sales, versus operating income of $4.4 million, or 4.4% of net sales in the prior year.
CFO John Zimmer commented, “The second-quarter gross margin of 21.0%, which is the highest quarterly gross margin in over 10 years, reflects operational improvements as well as a favorable product mix driven by normal seasonality of the business. We believe the second half of the year gross margins will be impacted by our normal seasonality, resulting in product mix shifts as well as lower fixed cost leverage from lower net sales, which we believe will produce a full-year gross margin in the range of 17% to 19%, compared to prior-year gross margin of 13.9%.”
Covenant Logistics Group, Inc. (CVLG)
(07/26/2023)
Covenant Logistics Group reported second-quarter earnings of $0.91 per diluted share and non-GAAP adjusted earnings of $1.07 per diluted share, the latter of which beat the I/B/E/S consensus estimate of $0.95 per share by 12.6%. Total revenue declined significantly from 2022, down 13.6% to $274 million for the quarter. Shipping rates and volume have declined since 2022.
(08/03/2023)
Ducommun reported second-quarter 2023 non-GAAP earnings per share of $0.54, missing the I/B/E/S consensus estimate of $0.575 per share by 6.1%. Total revenue increased 7.5% from the prior-year quarter to $187.32 million. During the quarter, the company also completed a stock offering with a value of $85.1 million using the proceeds to pay down debt.
(07/27/2023)
Escalade reported second-quarter 2023 financial results. The company reported net income of $2.7 million or $0.20 per diluted share for the quarter, declining from $12.3 million and $0.91 per diluted share, respectively, in the prior-year quarter. Total net sales declined 28.2% on a year-over-year basis in the second quarter, due to a combination of reduced post-pandemic consumer demand across most product categories and 21 fewer days in the company’s new reporting calendar compared to the year-ago period. The company generated $8.4 million of cash flow from operations in the second quarter of 2023, compared to $2.5 million for the same quarter in 2022.
Escalade also declared a quarterly dividend of $0.15 per share. The dividend is payable on September 5, to shareholders of record at the close of business on August 29. The stock will trade ex-dividend on Monday, August 28.
Friedman Industries, Incorporated (FRD)
(08/14/2023)
Friedman Industries reported first-quarter 2024 diluted earnings per share of $1.04, down 39% from the prior-year quarter. Net sales for the quarter were $137.3 million, a 23% increase over the prior-year quarter, and net earnings totaled $7.7 million, down 37% from the same period of 2023. The flat-roll product segment sales for the quarter totaled $125.2 million, down 13% from the comparable quarter of 2023. Tubular product segment sales totaled $12.1 million, down 43% from one year ago. Earnings from operations were $10.3 million, down 17% year over year.
Looking ahead, the company expects steady demand for second-quarter 2024, with sales volume expected to be approximately the same as the first quarter. Friedman Industries expects lower physical margins for the second quarter compared to the first quarter due to the hot-rolled steel coil price trend with hedging-related gains partially offsetting the impact of lower margins.
Lakeland Industries, Inc. (LAKE)
(08/01/2023)
Lakeland Industries declared a quarterly dividend of $0.03 per share, in line with the previous payment. The dividend is payable on August 22, to shareholders of record as of August 15. The stock will trade ex-dividend on Monday, August 14. Lakeland Industries’ current dividend yield is 0.8%.
Lazydays Holdings, Inc. (GORV)
(08/07/2023)
Lazydays Holdings announced the successful acquisition of Century RV in Longmont, Colorado. The store has been renamed Lazydays RV of Denver at Longmont, with Lazydays Holdings projecting approximately $50 million in annualized revenue from this venture.
(07/27/2023)
Lazydays Holdings reported second-quarter 2023 financial results. Net income for the second quarter of 2023 was $3.6 million, a notable decrease compared to $27.1 million reported for the same period in 2022. As a non-GAAP measure, the adjusted net income for the second quarter of 2023 was $3.9 million, down from $23.5 million for the same period in 2022. Net income per diluted share was $0.12, down from $0.81 per share in the prior-year quarter. On an adjusted basis, net income per diluted share was $0.14, which beat the I/B/E/S consensus estimate of $0.11 per share. The company had a decline in revenue for the second quarter of 2023, which amounted to $308.4 million, down from $373.6 million in the second quarter of 2022.
(07/25/2023)
Lazydays Holdings completed the acquisition of Buddy Gregg RVs & Motor Homes in Knoxville, Tennessee. They have renamed the store Lazydays RV of Knoxville at Turkey Creek and anticipate approximately $40 million in annualized revenue.
(08/02/2023)
Mistras Group reported second-quarter 2023 earnings of $0.05 per share, an increase of 340% from last quarter but 75.6% below the I/B/E/S consensus estimate of $0.205 per share. Revenue was $176.0 million, down 1.7% from $179 million in the same period of 2022. Year-to-date sales through June increased 19.4% to $344.0 million, from $340.6 million in the same period of 2022. Net income for the quarter was $337 million, down significantly from $4.6 billion in the comparable period of 2022.
(08/02/2023)
NACCO Industries reported second-quarter 2023 net income of $2.5 million, or $0.34 per share, down from $37.2 million, or $5.07 per share in the second quarter of 2022. Operating profit decreased 94.1% from $29.7 million to $1.75 million during the quarter.
The company expects consolidated results to continue to decrease in the third quarter before improving in the fourth quarter. Management continues to view the long-term business outlook for NACCO Industries positively, despite an expected significant decrease in full-year 2023 consolidated net income compared with 2022.
Pangaea Logistics Solutions Ltd. (PANL)
(08/09/2023)
Pangaea Logistics Solutions announced second-quarter adjusted net income of $4.6 million, or $0.10 per share, 64.7% below the I/B/E/S consensus estimate of $0.17 per share. In contrast, adjusted net income was $28.9 million in the same period of 2022, equating to $0.64 per diluted share. Operating cash flow was $2.0 million, a decrease of 95% year over year.Ttime-charter-equivalent (“TCE”) rates of $15,558 earned per day were 43% lower than the same quarter one year ago.
In addition, Pangaea Logistics Solutions declared a quarterly dividend of $0.10 per share, payable on September 15, to shareholders of record as of September 1. The stock will trade ex-dividend on Thursday, August 31.
(08/01/2023)
Rocky Brands reported second-quarter 2023 flat adjusted net income, compared to adjusted net income of $2.5 million for the same period last year. Adjusted earnings of $0.002 per share were above the I/B/E/S consensus estimate for a loss of $0.177 per share but down from earnings of $0.13 per share in the same quarter one year ago.
Strattec Security Corporation (STRT)
(08/10/2023)
Strattec Security announced a fiscal fourth-quarter net loss of $2.7 million, or a loss of $0.69 per share, significantly below the I/B/E/S consensus estimate for a loss of $0.20 per share. The current year’s fourth quarter included a $4.7 million net loss associated with an equity restructuring agreement that equated to a loss per share of $1.19.
The Container Store Group, Inc. (TCS)
(08/01/2023)
Container Store Group reported a first-quarter 2023 loss of $0.24 per share, 26.3% below the I/B/E/S consensus estimate for a loss of $0.19 per share. Net sales for the quarter were $207.1 million, down 21.1% compared to the first quarter of fiscal 2022. Comparable-store sales were down 19.9% compared to the same quarter one year ago. The company reported a net loss of $11.8 million, in contrast to net income of $10.5 million for the same period of fiscal 2022.
Vishay Precision Group, Inc. (VPG)
(08/08/2023)
Vishay Precision Group reported second-quarter adjusted earnings of $0.58 per share, compared to $0.68 per share in the second quarter of 2022, but 16.0% above the I/B/E/S consensus estimate of $0.50 per share. Net income was $8.0 million compared to $9.3 million one year ago. Operating margin was 13.0%, compared to 11.9% one year ago. Gross profit margin was 42.6%, compared to 42.1% one year ago. The company reported cash from operating activities of $9.8 million, with adjusted free cash flow of $6.4 million.
Looking forward, CEO Ziv Shoshani commented, “We expect net revenues to be in the range of $85 million to $95 million for the third fiscal quarter of 2023, at constant second fiscal quarter 2023 foreign currency exchange rates.”
Vishay Precision Group also announced that its board of directors has extended by an additional year the previously granted authorization for stock repurchase. This empowers the company to buy back a total of 502,500 shares of its outstanding common stock.
(07/26/2023)
VSE Corp. reported second-quarter 2023 financial results. The company had non-GAAP earnings per diluted share of $0.82, beating the I/B/E/S consensus estimate of $0.749 per share by 9.5%. Total revenue for the company totaled $205.2 million, increasing 20.9% over the comparable period of 2022. Adjusted EBITDA increased by 44.3% to $26.5 million. Adjusted net income grew by 58.7% to $10.6 million.
Moreover, VSE Corp. successfully completed a follow-on equity offering, issuing 2,475,000 shares of common stock at $48.50 per share, resulting in net cash proceeds of approximately $112.7 million. These proceeds were used to repay outstanding borrowings under the company’s revolving credit facility, significantly enhancing its balance sheet flexibility. This enhanced financial position enables VSE Corp. to pursue both organic and inorganic growth opportunities.
 Get updates about the portfolio that has outperformed the market by 211.9%
since inception!
Get updates about the portfolio that has outperformed the market by 211.9%
since inception!