


James B. Cloonan
founded AAII in 1978. He served as president until 1992 and as chairman until his retirement in 2018. He authored the book "Investing at Level3: Higher Returns With Minimal Risk for the Long-Term Individual Investor."
The strong five-year bull market continued in December, slowed in January for some profit realization, and tried to continue in February.
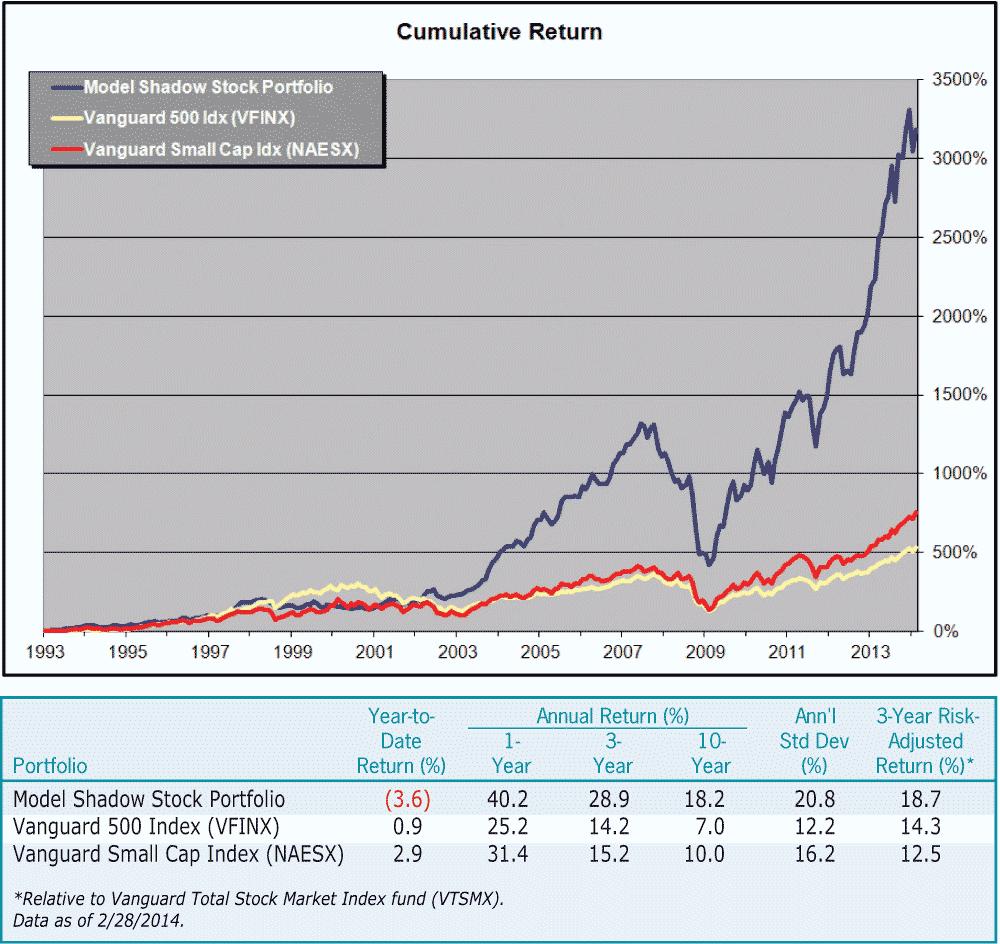
January represented quite a pullback for the Model Shadow Stock Portfolio. The year-to-date return through February is –3.6% as opposed to +0.9% for the S&P 500 index, as measured by the Vanguard 500 Index fund (VFINX). As I write this in early March, small stocks have strengthened again. Returns for longer periods can be seen in Figure 1 and Table 3.
This has been a very long bull market without any significant correction, although most pundits have been predicting one for over a year. The market is still behind where it would have been if it had risen by its average of 12% a year from 2006 and avoided the great recession. Undoubtedly there will be a correction sometime, but it could be in two weeks or two years.
| Current | 52-Week | Market | P/E | P/B | Div | |||
| Price | High | Low | Cap | Ratio | Ratio | Yield | ||
| Company (Ticker) | ($) | ($) | ($) | ($ Mil) | (X) | (X) | (%) | Notes |
| Alamo Group, Inc. (ALG) |
52.58
|
61.27
|
35.34
|
635.2
|
18.7
|
1.87
|
0.5
|
approaching size limit |
| Alpha & Omega Semicon (AOSL) |
7.29
|
9.30
|
6.64
|
189.5
|
nmf
|
0.66
|
0.0
|
earnings probation (2013 Q4) |
| CSS Industries Inc (CSS) |
27
|
31.94
|
21.57
|
251.0
|
13.9
|
0.97
|
2.2
|
|
| Ducommun Incorporated (DCO) |
27.8
|
31.35
|
14.32
|
301.3
|
17.3
|
1.24
|
0.0
|
|
| Ennis, Inc. (EBF) |
15.8
|
19.59
|
13.54
|
414.4
|
11.9
|
1.09
|
4.4
|
|
| Five Star Quality Care (FVE) |
5.79
|
6.87
|
4.41
|
281.5
|
25.2
|
0.90
|
0.0
|
|
| Flexsteel Industries (FLXS) |
37.15
|
37.80
|
18.56
|
268.3
|
22.4
|
1.72
|
1.6
|
|
| Hardinge Inc. (HDNG) |
14.75
|
16.88
|
11.91
|
175.3
|
41.0
|
0.88
|
0.5
|
|
| Hooker Furniture Corp. (HOFT) |
15.1
|
18.31
|
13.35
|
162.4
|
17.0
|
1.21
|
2.6
|
|
| International Shipholding (ISH) |
30.46
|
32.12
|
16.07
|
220.8
|
14.9
|
0.66
|
3.3
|
qualified as of 2/28/2014 |
| Key Tronic Corp. (KTCC) |
10.35
|
12.19
|
9.60
|
109.0
|
11.3
|
1.09
|
0.0
|
|
| Kimball International (KBALB) |
18.77
|
19.86
|
8.63
|
571.4
|
24.7
|
1.70
|
1.1
|
|
| LMI Aerospace, Inc. (LMIA) |
14.91
|
22.69
|
10.81
|
191.7
|
19.9
|
0.89
|
0.0
|
|
| Marlin Business Services (MRLN) |
21.5
|
29.58
|
17.32
|
279.4
|
16.8
|
1.65
|
2.0
|
|
| Medical Action Industries (MDCI) |
7.32
|
10.07
|
5.04
|
120.0
|
30.5
|
1.21
|
0.0
|
|
| Mitcham Industries (MIND) |
14.39
|
18.41
|
13.58
|
184.2
|
30.6
|
1.06
|
0.0
|
|
| Olympic Steel, Inc. (ZEUS) |
27.51
|
31.68
|
19.54
|
301.7
|
nmf
|
1.01
|
0.3
|
|
| PC Connection, Inc. (PCCC) |
20.25
|
25.94
|
13.83
|
530.5
|
15.0
|
1.66
|
0.0
|
|
| PCM Inc. (PCMI) |
9.71
|
11.96
|
6.02
|
113.7
|
13.5
|
0.91
|
0.0
|
|
| RCM Technologies (RCMT) |
6.91
|
7.22
|
5.29
|
86.0
|
18.7
|
1.36
|
0.0
|
|
| Renewable Energy Group (REGI) |
11.67
|
16.50
|
5.90
|
451.4
|
2.9
|
0.71
|
0.0
|
|
| REX American Resources (REX) |
47.68
|
49.93
|
17.12
|
385.1
|
28.9
|
1.47
|
0.0
|
|
| Rocky Brands Inc. (RCKY) |
13.76
|
19.97
|
13.13
|
103.4
|
14.0
|
0.79
|
2.9
|
qualified as of 2/28/2014 |
| SigmaTron International (SGMA)* |
10.71
|
10.80
|
3.77
|
42.4
|
23.3
|
0.79
|
0.0
|
qualified as of 2/28/2014 |
| Salem Communications (SALM) |
9.09
|
10.14
|
6.17
|
226.5
|
nmf
|
1.15
|
2.4
|
earnings probation (2013 Q1) |
| Shoe Carnival, Inc. (SCVL) |
25.84
|
29.75
|
19.19
|
529.5
|
17.9
|
1.63
|
0.9
|
|
| Standard Motor Products (SMP) |
35.15
|
39.99
|
24.52
|
806.9
|
15.4
|
2.32
|
1.5
|
approaching size & value limits |
| TravelCenters of America (TA) |
9.06
|
12.50
|
6.71
|
340.9
|
15.6
|
0.67
|
0.0
|
|
| VOXX International (VOXX) |
13
|
18.00
|
8.91
|
316.9
|
9.6
|
0.66
|
0.0
|
|
| Willis Lease Finance (WLFC) |
17.9
|
18.24
|
11.70
|
150.9
|
17.9
|
0.72
|
0.0
|
|
| *Company is new to the portfolio as of 3/3/2014. | ||||||||
| nmf = no meaningful figure. | ||||||||
| Source: AAII’s Stock Investor Pro/Thomson Reuters. Data as of 2/28/2014. | ||||||||
Our general rules for the Model Shadow Stock Portfolio permit foreign stocks if they are listed on a U.S. exchange. Our (possibly) temporary rule against companies located in China or doing most of their business in China is not included in the general screening criteria, nor is our elimination of stocks not trading an average of $150,000 in volume per day included. These screens must be performed manually if you choose to use them or a variation of them.
We are also amending the rules for selling stocks based on high price-to-book ratio or market capitalization. We will not sell based on these criteria unless we have a stock to buy. This has never been a problem over the last 20 years, but it has recently become a concern.
The world can change between the time we purchase a stock and the time you find out about it. You should check recent news on the company to make sure nothing has happened that would disqualify it.
| Buy | |
| Company (Ticker) | Maximum Price to Pay |
| SigmaTron International (SGMA) | $12.20 |
| Sell | |
| Company (Ticker) | Reason for Selling |
Gilat Satellite Networks Ltd.  (GILT) (GILT) |
negative earnings |
You should also never pay a price-to-book ratio over 0.90. While 0.80 is our normal criterion, going as high as 0.90 is acceptable. To help with this, we will now indicate in Table 2 the maximum price to be paid for new additions to the portfolio.
Table 1 shows the current holdings in the Model Shadow Stock Portfolio. We sold Gilat Satellite Networks (GILT) because it violated probation.
After eliminating Chinese stocks and those we already owned, there was only one qualifying stock, SigmaTron Int’l (SGMA), and we bought it. As Table 2 indicates, the maximum price to pay for SGMA would be $12.20 per share, based on the company’s current book value of $13.56 multiplied by our maximum price-to-book criterion of 0.90.
Almost all the economic data indicates a slow and steady recovery. The extreme winter weather had an effect, but everyone seems to be allowing for that. The only negative I see is the fact that things look too good, and as a moderate contrarian this always worries me a bit. Of course, as always, there are international concerns, and we have a mid-term election coming up that will probably stir up real and imagined concerns.
| Average Annual Return (%) | Cumulative Value of $10,000 ($) | ||||||
| Model | Vanguard | Vanguard | Model | Vanguard | Vanguard | ||
| Shadow | 500 | Small Cap | Shadow | 500 | Small Cap | ||
| Stock | Index | Index | Stock | Index | Index | ||
| Year | Portfolio |
(VFINX) |
(NAESX) | Portfolio |
(VFINX) |
(NAESX) | |
| 1993 | 32.3 | 9.9 | 18.7 | 13,230 | 10,989 | 11,870 | |
| 1994 | 2.0 | 1.2 | -0.5 | 13,492 | 11,118 | 11,810 | |
| 1995 | 20.7 | 37.4 | 28.7 | 16,291 | 15,282 | 15,204 | |
| 1996 | 22.3 | 22.9 | 18.1 | 19,927 | 18,775 | 17,959 | |
| 1997 | 44.3 | 33.2 | 24.6 | 28,756 | 25,010 | 22,375 | |
| 1998 | -8.9 | 28.6 | -2.6 | 26,188 | 32,168 | 21,790 | |
| 1999 | 0.0 | 21.1 | 23.1 | 26,187 | 38,945 | 26,831 | |
| 2000 | -7.7 | -9.1 | -2.7 | 24,163 | 35,418 | 26,116 | |
| 2001 | 21.4 | -12.0 | 3.1 | 29,325 | 31,160 | 26,926 | |
| 2002 | 10.8 | -22.1 | -20.0 | 32,506 | 24,259 | 21,535 | |
| 2003 | 73.1 | 28.5 | 45.6 | 56,268 | 31,174 | 31,360 | |
| 2004 | 43.7 | 10.8 | 19.9 | 80,843 | 34,530 | 37,587 | |
| 2005 | 17.9 | 4.8 | 7.4 | 95,353 | 36,180 | 40,376 | |
| 2006 | 29.4 | 15.6 | 15.6 | 123,363 | 41,832 | 46,687 | |
| 2007 | -1.8 | 5.4 | 1.2 | 121,166 | 44,083 | 47,227 | |
| 2008 | -50.8 | -37.0 | -36.0 | 59,582 | 27,764 | 30,217 | |
| 2009 | 72.3 | 26.5 | 36.1 | 102,665 | 35,120 | 41,130 | |
| 2010 | 45.4 | 14.9 | 27.7 | 149,238 | 40,358 | 52,529 | |
| 2011 | 6.3 | 2.0 | -2.8 | 158,701 | 41,155 | 51,067 | |
| 2012 | 33.3 | 15.8 | 18.0 | 211,588 | 47,666 | 60,274 | |
| 2013 | 61.0 | 32.2 | 37.6 | 340,599 | 63,009 | 82,966 | |
| YTD | -3.6 | 0.9 | 2.9 | 328,176 | 63,596 | 85,359 | |
| Since Incep | 17.9 | 9.1 | 10.7 | 328,176 | 63,596 | 85,359 | |
| Data as of 2/28/2014. | |||||||
I have always felt that the majority of pundits will be wrong when predicting markets. Last year was a perfect example: There were a significant number of experts predicting a strong down year, a modest down year or a moderate up year. Virtually no one was predicting a strong up year, and that is what we got.
This year, we have many predictions for a significant correction and for a modest up year. That leaves a modest down year or another strong up year as likely outcomes. As always, only time will tell.
We will be covering the Model Shadow Stock Portfolio again in the July AAII Journal. In the meantime, you will be able to follow it at AAII.com.
 Get updates about the portfolio that has outperformed the market by 211.9%
since inception!
Get updates about the portfolio that has outperformed the market by 211.9%
since inception!