“The real key to making money in stocks is not to get scared out of them.”—Peter Lynch
As investors, our convictions are frequently tested. We may understand intellectually that the stock market offers the greatest opportunity to maximize our long-term wealth, but we must have the emotional strength to live with the short-term volatility that helps boost long-term stock returns.
The Model Shadow Stock Portfolio bounced back during March but remains down 8.1% year to date as of the end of March. The S&P 500 index as measured by the Vanguard 500 Index fund (VFINX) has lost 0.8% during the first three months of the year. The Vanguard Small Cap Index fund (NAESX) is down 0.2% year-to-date. A chart of long-term performance along with compound annual returns can be found here. The current Model Shadow Stock Portfolio can be found here.
The Model Shadow Stock Portfolio is down around 11.6% since the end of November. While the overall stock market has been in a protracted bull market that extends just over nine years, that is very unusual. A 10% decline is considered a correction. On average, the market has had a 10% correction once per year over the long term. Most corrections last around two months. Over the 25-year history of the Model Shadow Stock Portfolio, it has experienced nine declines of at least 10%.
Four of the Model Shadow Stock Portfolio corrections went on to become bear markets, during which the market declines at least 20%. Historically, the stock market has had a bear market every three to five years. Post–World War II, there have been 14 bear markets, or roughly one every five years. No matter how severe the bear market, the stock market has eventually turned around and gone on to hit new highs.
It may be tempting to think that you can improve your rate of return by getting out of the market during declines and jumping back in when the market improves. However, it has been shown that the best and worst trading days tend to be clustered together. Missing the worst days typically also means missing the best days. A J.P. Morgan study notes that six of the 10 best trading days of the market occurred within two weeks of the 10 worst trading days.
We thought it would be revealing to see what impact simply missing the best-performing month of a given year would have on the return realized by the Model Shadow Stock Portfolio for the year and how that would impact its long-term rate of return. The table below displays the year-by-year returns for the Model Shadow Stock Portfolio, the Vanguard 500 Index fund  (VFINX) and the Vanguard Small Cap Index fund (NAESX). The first column shows the annual return for each and then how the return for the year would be impacted if the best month during the year was ignored for each year.
Model Shadow Stock Portfolio: Annual Performance
| Year | Model Shadow Stock Portfolio |
Vanguard 500 Index (VFINX) |
Vanguard Small Cap Idx (NAESX) |
|||
|---|---|---|---|---|---|---|
| Annual Return (%) | Return Less Best Month (%) | Annual Return (%) | Return Less Best Month (%) | Annual Return (%) | Return Less Best Month (%) | |
| 1993 | 32.3 | 23.3 | 9.9 | 5.9 | 18.7 | 13.9 |
| 1994 | 2.0 | -3.2 | 1.2 | -2.8 | -0.5 | -5.7 |
| 1995 | 20.7 | 15.6 | 37.4 | 31.7 | 28.7 | 21.7 |
| 1996 | 22.3 | 11.8 | 22.9 | 14.2 | 18.1 | 11.5 |
| 1997 | 44.3 | 30.1 | 33.2 | 23.4 | 24.6 | 12.2 |
| 1998 | -8.9 | -13.8 | 28.6 | 18.9 | -2.6 | -9.4 |
| 1999 | 0.0 | -7.5 | 21.1 | 13.9 | 23.1 | 10.5 |
| 2000 | -7.7 | -11.0 | -9.1 | -17.1 | -2.7 | -16.5 |
| 2001 | 21.4 | 13.2 | -12.0 | -18.4 | 3.1 | -4.3 |
| 2002 | 10.8 | 0.0 | -22.1 | -28.4 | -20.0 | -26.5 |
| 2003 | 73.1 | 51.7 | 28.5 | 18.7 | 45.6 | 32.9 |
| 2004 | 43.7 | 28.9 | 10.8 | 6.5 | 19.9 | 11.5 |
| 2005 | 17.9 | 6.5 | 4.8 | 1.0 | 7.4 | 1.1 |
| 2006 | 29.4 | 20.0 | 15.6 | 12.0 | 15.6 | 7.2 |
| 2007 | -1.8 | -6.5 | 5.4 | 0.9 | 1.2 | -3.1 |
| 2008 | -50.8 | -53.3 | -37.0 | -39.9 | -36.0 | -39.4 |
| 2009 | 72.3 | 37.9 | 26.5 | 15.5 | 36.1 | 15.1 |
| 2010 | 45.4 | 27.9 | 14.9 | 5.5 | 27.7 | 14.1 |
| 2011 | 6.3 | -8.6 | 2.0 | -8.1 | -2.8 | -15.7 |
| 2012 | 33.3 | 20.8 | 15.8 | 10.9 | 18.0 | 10.4 |
| 2013 | 61.0 | 45.3 | 32.2 | 25.7 | 37.6 | 29.1 |
| 2014 | -5.8 | -12.2 | 13.5 | 8.5 | 7.4 | 2.2 |
| 2015 | -15.2 | -19.7 | 1.3 | -6.6 | -3.8 | -9.1 |
| 2016 | 29.8 | 15.7 | 11.8 | 4.7 | 18.2 | 8.8 |
| 2017 | 14.0 | 2.7 | 21.7 | 17.0 | 16.1 | 11.2 |
| 2018 YTD | -8.1 | -9.3 | -0.8 | -6.2 | -0.2 | -3.0 |
| Since Incep | 15.4 | 5.4 | 9.4 | 2.7 | 10.2 | 1.8 |
| Data as of 3/31/2018. | ||||||
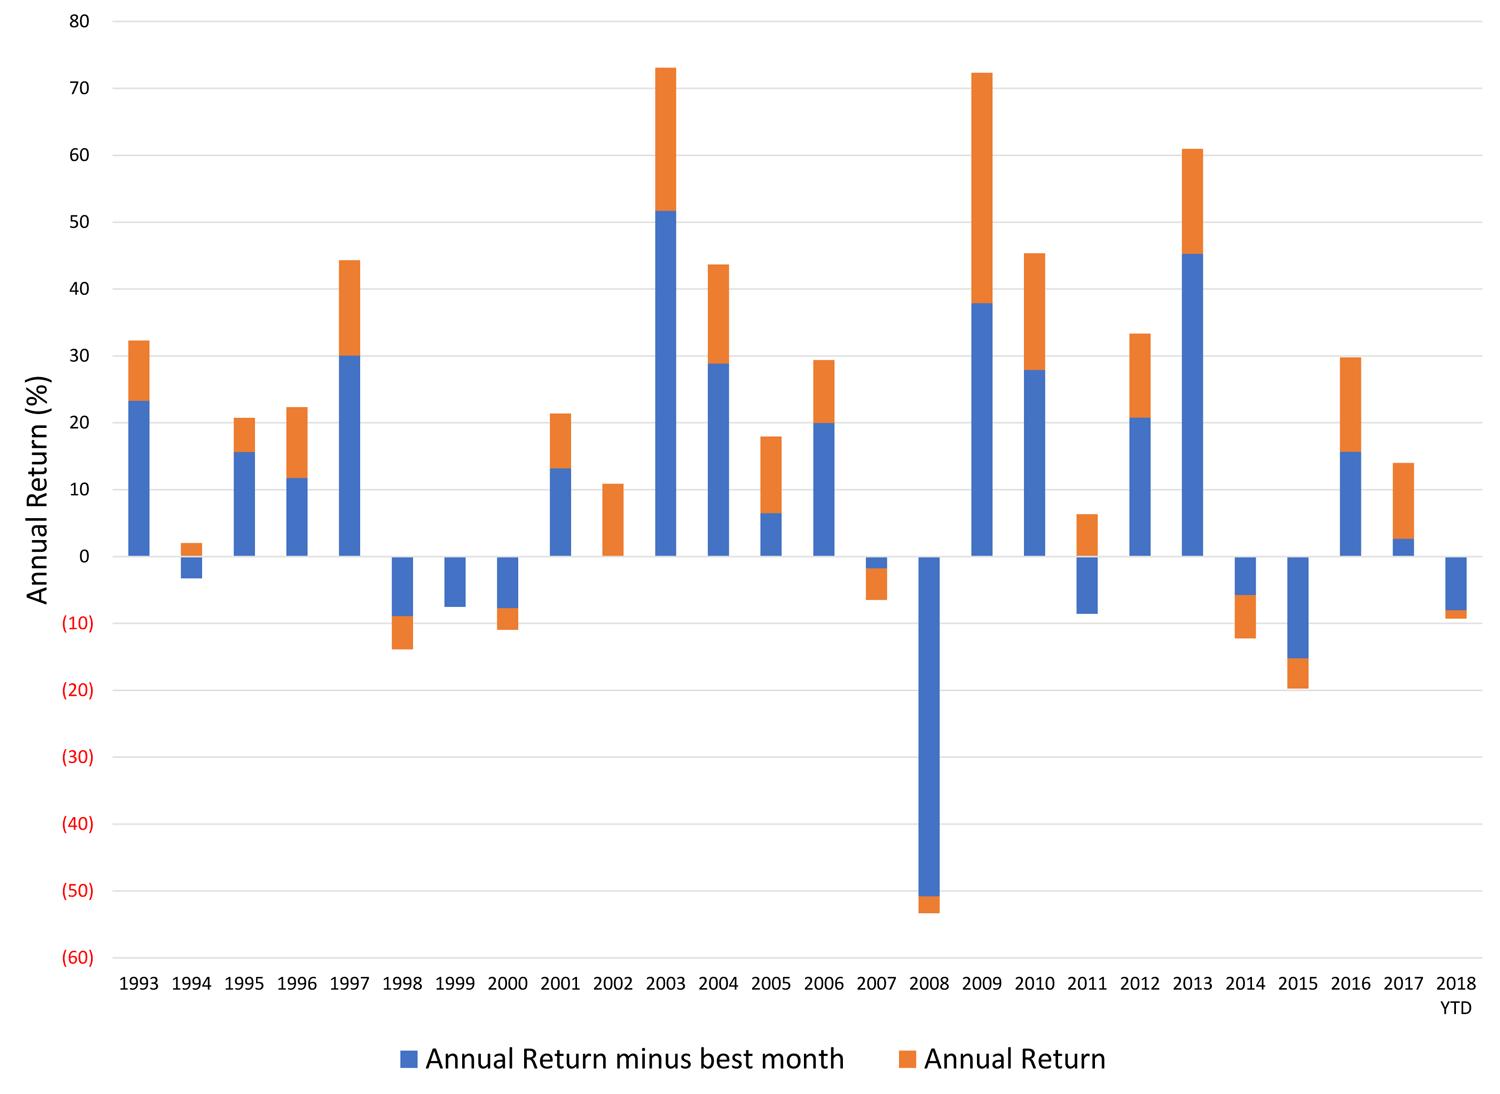
For example, the Model Shadow Stock Portfolio gained 32.3% during 1993. The greatest monthly gain during 1993 came in December, when the portfolio gained 7.32%. Due to the impact of compounding, the annual return for the Model Shadow Portfolio is reduced from 32.3% to 23.3% when the impact of gaining 7.32% during December of that year is taken out of the equation [(1 + 0.323) ÷ (1 + 0.0732) – 1]. Being out of the market during the best-performing month each year over the 25-year history of the Model Shadow Stock Portfolio reduced the compound annual return from 15.4% to 5.4%. The annual return of the Vanguard 500 Index fund is reduced from 9.4% to 2.7%, while the Vanguard Small Cap Index fund has its 10.2% compound annual return cut to 1.8%.
To visually illustrate the year-by-year impact of removing the best-performing month for each year, we created bar charts that show the total gain for each year and how much lower the annual return would be if it is reduced by being out of the market during the best month of the year. These can be seen below.
Market-Timing Risk: S&P 500 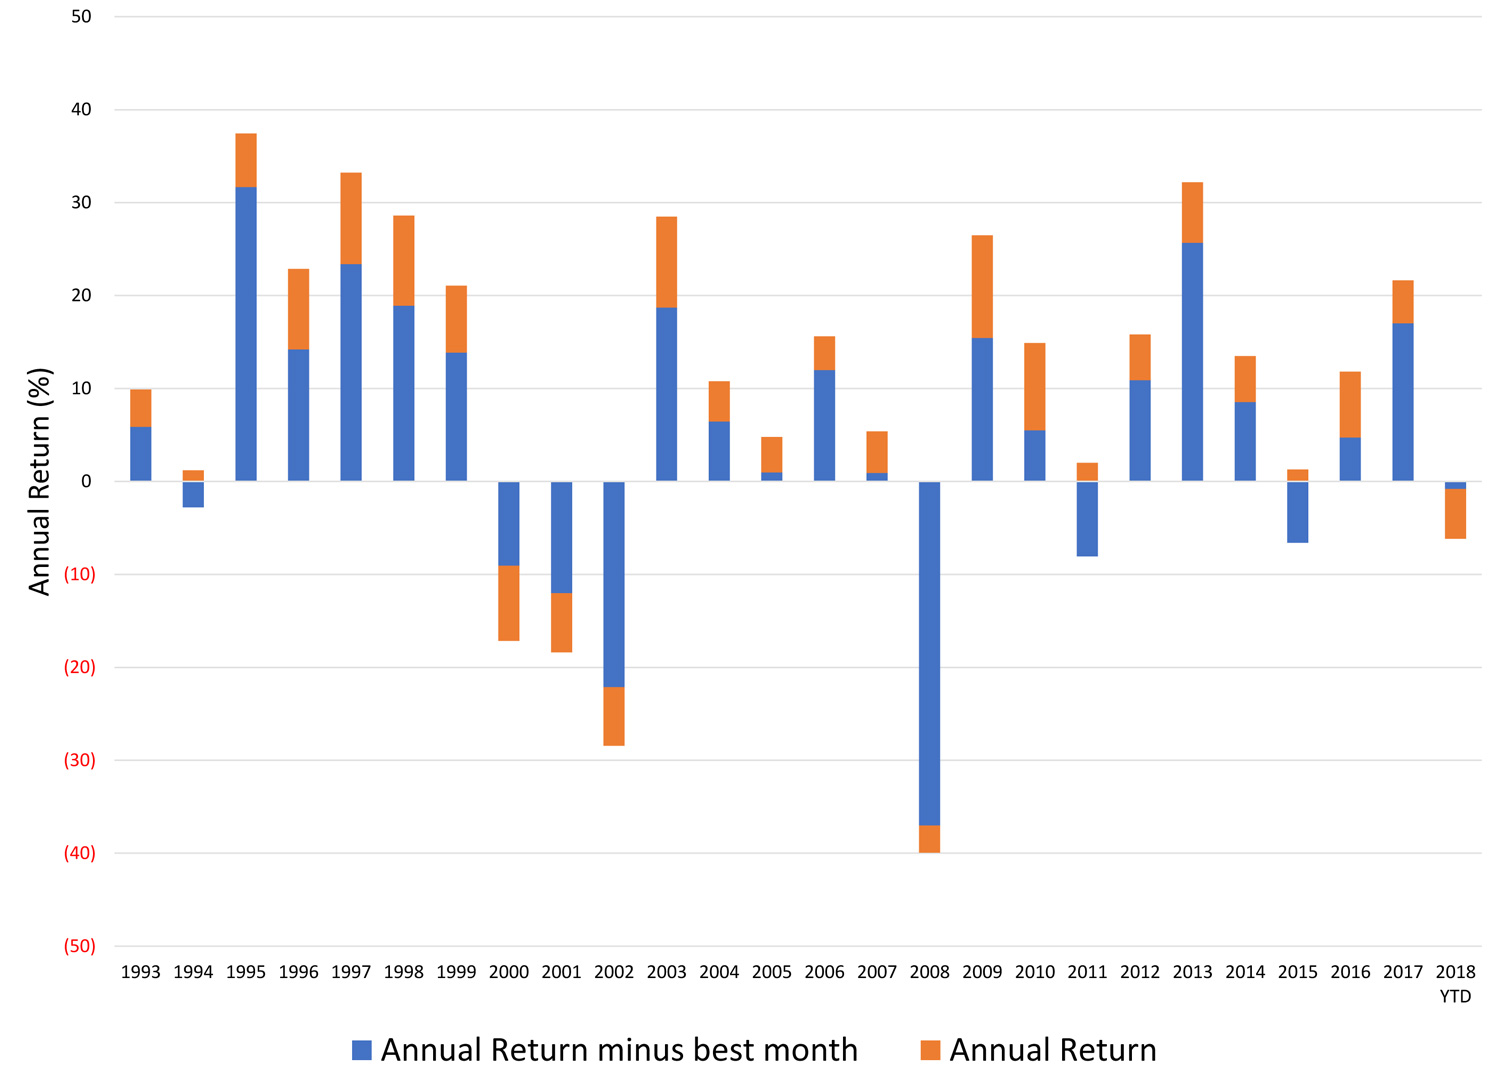 (VFINX)
The impact of missing the best month of each year
(VFINX) The impact of missing the best month of each year" src="https://www.aaii.com/files/images/articles/10172-figure-3.jpg" style="width: 600px; height: 432px;" />
For an investor looking to maximize their long-term wealth, risk is not a stock market crash, risk is being out of the market.
We will report on any quarterly portfolio actions for the Model Shadow Stock Portfolio in the July AAII Journal. You can follow the portfolio here on AAII.com. To receive monthly email updates along with alerts to any changes made to the portfolio, please sign up at www.aaii.com/email.
 Get updates about the portfolio that has outperformed the market by 211.9%
since inception!
Get updates about the portfolio that has outperformed the market by 211.9%
since inception!