
Investing is not always easy. A great deal of evidence supports the notion that over the long term, stocks of smaller companies tend to have greater returns than those of larger companies.
As an individual investor, you may sometimes feel like the deck is stacked against you. Well-funded mutual funds, pension funds and hedge funds have teams of analysts pouring over company reports, performing industry analysis and talking to management to create models to identify the “true value” of a company.

However, what if we told you there was a segment of the stock market where you have the advantage over Wall Street. That there are stocks out there that, historically, have significantly outperformed the overall market yet professional money managers and high-frequency traders cannot buy and sell. Where a patient investor who is willing to commit the time and effort to follow a disciplined approach can succeed. The market segment? Micro-cap value.
Here at AAII, it's a segment we've studied extensively and it represents the backbone of our Model Shadow Stock Portfolio. See Figure 1.
Small Caps
One of the most hotly contested topics in finance academia is that of the “small-firm effect.” For over 40 years, a mountain of research has been published trying to both prove and debunk the notion that investing in smaller companies will generate superior returns compared to investing in larger stocks, given the same level of risk.
One common measure of company size is market capitalization, or market cap. We calculate it by multiplying the current share price of a stock by the number of shares outstanding for a company. Market capitalization represents the public’s consensus of a company’s net worth.
One of the first studies related to the small-cap effect was “The Relationship Between Return and Market Value of Common Stocks” by Rolf Banz in 1981. There, Banz suggested that a company’s size was a contributing factor to its stock’s return. His findings show that the size of a firm and the return on its common stock are inversely related. In other words, the smaller the company, the better its stock’s return.
Risk & Return
One counter-argument to investing is smaller companies is that they are riskier and this added risk is the reason for their higher returns. Some argue that, even though the returns of smaller stocks are higher than those of larger stocks, the added risk of smaller companies is not worth the extra returns.
Small-company stocks do possess more risk than do large-firm stocks on an absolute level. The smallest stocks had an average annual standard deviation of 42.8% from 1926 to 2014, compared to 19.1% for the largest stocks.
However, Banz and others found that, when adjusted for risk, the returns for small-company stocks still outperformed those of larger-firm stocks. For his research, Banz created five portfolios containing the largest to smallest stocks listed on the New York Stock Exchange (NYSE). Over the 50-year period he studied, Banz found that the four portfolios containing the largest NYSE firms generated an average risk-adjusted excess annual return of -0.72%. On the other hand, the portfolio containing the smallest NYSE companies provided a risk-adjusted excess rate of return of nearly +6% a year.
While Banz’ research focused only on NYSE-listed stocks, Professors Thomas Cook and Michael Rozeff from the University of Iowa examined the small-firm effect using stocks listed on the NYSE, Amex and those traded over-the-counter (OTC) over the period 1968 to 1978. They divided 3,130 stocks into 10 portfolios, each containing an equal number of stocks, on the basis of market cap. What they found was that the four portfolios with the lowest market caps provided risk-adjusted average annual excess returns of 1.69% to 5.54%, while the remaining six portfolio with the larger company stocks all generated negative annual excess returns ranging from -0.12% to -4.12%.
So while small-company stocks may experience significant volatility over short-term periods, investors who hold these same stocks over longer periods of time have seen better risk-adjusted returns than what they would have received investing in larger-company stocks.
Fama & French
Perhaps the most-quoted study when it comes to the small-cap effect is from University of Chicago professors Eugene Fama and Kenneth French. Their 1992 research, “The Cross-Section of Expected Stock Returns” found that company size, as measured by market cap, helped explain market returns. Fama and French examined the companies that traded on the New York Stock Exchange (NYSE) and divided them into deciles (10% increments) based on their market capitalization. What they found was that the smallest companies—those in the 10th decile based on market cap—outperformed the stocks with larger market caps.
The table below supports this research, based on performance data between 1926 and the end of 2014. The smallest companies in the 10th decile have, on average, generated an annual return of 13.5% over that period. By comparison, the companies in the S&P 500—the 500 largest companies traded on U.S. exchanges based on market cap—generated an average annual return of 10.1% over the same period. So if you invested $1,000 in these 10th-decile stocks at the beginning of 1926, you would have had $79,455,996 at the end of 2014, versus $5,235,865 if you had invested the same $1,000 in the S&P 500.

Small Cap Versus Micro Cap
It is also worth pointing out that the notion of “small cap” takes on different meaning depending on who is using the term. Following Banz’ research, small firms were defined as those of all public companies with market capitalizations in the bottom 20% of NYSE-listed stocks. However, as professional investors attempted to exploit the small-firm effect outlined by Banz and Fama and French, the definition morphed to refer to the smallest companies that institutional investors could reasonably invest in; meaning they offer sufficient liquidity and narrow enough bid-ask spreads to allow mutual funds, pension funds, etc., to invest tens if not hundreds of millions of dollars in a given stock without affecting the stock price.
Looking at the table above, the small-cap universe lives in the sixth, seventh and eighth deciles. At the end of 2014, the largest stocks in these deciles ranged from $1.01 billion to $2.54 billion. Investopedia defines a “small-cap” company as one that, generally, has a market capitalization of between $300 million and $2 billion. However, it acknowledges that the definition differs from brokerage to brokerage and data provider to data provider. The S&P SmallCap 600 index, as defined by Standard and Poor’s, measures the small-cap segment of the U.S. equity market. These are U.S. companies with, as of the end of January 2016, market caps between $400 million and $1.8 billion. The mean market cap of the companies in the index as of January 29, 2016, was $1.03 billion and ranged from $41.4 million and $4.7 billion.
There is also the Russell 2000 index, considered to be a more comprehensive index representing “small” stocks. As of December 31, 2016, the median market cap of the companies in the index was $701 million, and the largest had a market cap of $6.4 billion.
However, since the mutual fund industry’s definition of small-cap excluded the companies at the very lowest end of the market-cap spectrum, a new designation was born: micro-cap. Using the definition in the original Banz study (the bottom quintile, or deciles 9 and 10), a small-cap firm at the end of 2014 had a market capitalization below $549 million. Investopedia defines a micro-cap stock as one having a market cap between approximately $50 million and $300 million. The FTSE TM Micro Cap Index, as of January 29, 2016, consisted of the 1,272 smallest stocks traded on the U.S. market. The median market cap of these stocks was $53 million and the largest had a market cap of $261 million.
Diversification Benefits of Small-Company Stocks
Beyond the performance benefits of investing in small stocks that we have just covered, research also suggests that there are diversification benefits to adding small-firm stocks to portfolios of large-firm stocks.
The following table illustrates the cross correlations of annual returns for the same deciles in the previous table. In this context, correlation measures how well the stocks in the various market cap deciles move in relation to each other. Correlation coefficients range between -1 and +1. Perfect positive correlation (a correlation coefficient of +1) implies that as one security moves, either up or down, the other security will move in lockstep, in the same direction. Alternatively, perfect negative correlation means that if one security moves in either direction the security that is perfectly negatively correlated will move in the opposite direction. If the correlation is 0, the movements of the securities are said to have no correlation; they are completely random.
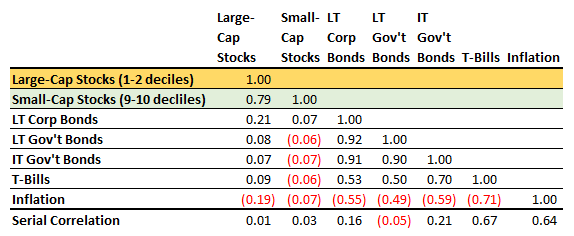
The correlation between micro caps—stocks in the bottom two deciles based on market cap—and large-company stocks is 0.79. This means that, while the returns of micro-cap and large-cap stocks tend to move in the same direction, they do not do so in lockstep. In addition, the volatility in micro-cap stocks that is attributable to the volatility in the S&P 500—a common measure of the overall market—is 62%.
By creating a portfolio of small and large firms, you are able to boost the diversification benefits.
Limited Liquidity
We have mentioned that the micro-cap segment of the market is an area where individual investors don’t have to compete with professional investors. One of the reasons why pension funds, mutual funds and high-frequency traders are not able to invest in micro-cap stocks is because of their limited trading volume. Many micro-cap stocks may only trade, on average, hundreds or thousands of shares a day compared to millions for many large-cap stocks. The money that professional investors move in and out of stocks would have a significant impact on the prices of such thinly traded stocks.
While limited liquidity does limit the number of players in the micro-cap arena, it also leads to higher bid-ask spreads—the amount by which the ask price exceeds the bid price. This is essentially the difference in price between the highest price that a buyer is willing to pay (the bid price) for a stock and the lowest price for which a seller is willing to sell it (the ask price). The wider the spread, the higher the cost of transacting in the stocks—the higher the price you pay to buy it and the less you will receive when selling.
For this reason, investing in micro caps takes patience and a long-term investment horizon. The higher relative bid-ask spreads for micro caps means they are not suited for trading, as the costs would eat away any profits. However, this “liquidity risk” can be mitigated by those who are willing to enter into and exit out of their positions slowly, so as to not impact the share price. Furthermore, holding micro-cap positions longer—minimizing turnover—will lessen the impact of the higher bid-ask spreads.
Neglected Firms
Since institutional investors tend to stay away from micro-cap stocks, they tend to have very little analyst coverage. This also is an advantage for individual investors who are willing to perform their own research.
In their 1982 research, “The Neglected and Small Firm Effects,” Professors Avner Arbel and Paul Strebel found that the stocks of less-researched companies offer greater risk-adjusted returns than more-researched companies. In their study of S&P 500 index companies over the period from 1972 to 1976, the portfolio of least-researched stocks had higher returns each year than that of the most-researched.
Because few, if any, brokerage firms cover small companies, there is a greater possibility of market inefficiencies. The markets are generally efficient and price stocks correctly over the long term. However, part of that efficiency is tied to liquidity. The prices of large-cap stocks likely reflect their future value completely, because of their liquidity and the amount of news and research that is available on them.
However, because most small companies have relatively few shares freely trading, a liquidity problem exists. The liquidity problem prevents many large institutions from investing in these companies. This reduces the number of buyers for the stock and can cause the stock price to be unjustifiably low. So an individual investor willing to spend the time researching micro-cap stocks may be able to find these mispriced stocks. Over the long term, the market should adjust the prices of these undervalued stocks, generating gains for those who were able to identify the short-term mispricing.
Summary
History has shown that small companies have provided superior risk-adjusted returns compared to large companies. Research has shown that this may stem from illiquidity, a lack of research or analyst coverage some other factors. While micro-cap stocks do tend to have greater volatility and higher trading costs (wider bid-ask spreads), they offer long-term investors an opportunity to capitalize in market inefficiencies that large professional investors cannot. In addition, these stocks offer diversification benefits when added to a portfolio of larger-company stocks, since the two groups to not move in perfect unison. For these reasons, micro-cap stocks have a place in the portfolios of individual investors.
|
Investing is not always easy. A great deal of evidence supports the notion that over the long term, stocks of smaller companies tend to have greater returns than those of larger companies. |
While the market is generally efficient, there are times when stocks may trade below their intrinsic value. Here are a few factors that may drag a stock's price below its true value. |
With the right education and information,
individual investors are fully capable of
becoming effective managers of their own
assets. |