
On Tuesday, The Wall Street Journal observed in its morning briefing that “The S&P 500 has gone 53 trading days without a move of 1% in either direction, the longest such streak since January.” As of today’s close, the streak now stands at 56 days. This is just the fifth time in five years that the large-cap index has posted a gain or decline of less than 1% over a span of at least 50 consecutive market days, the newspaper stated.
The calm waters are quite a change from what we experienced at the start of the year. During February and March alone, the S&P 500 index closed down by at least 1% on 11 different days and rose by at least 1% 12 times. Including January and the first few days of April, the S&P 500 experienced a total of 25 days where it moved up or down by at least 1%. The volatility included six days with a drop of at least 2% and one day with a gain of at least 2%.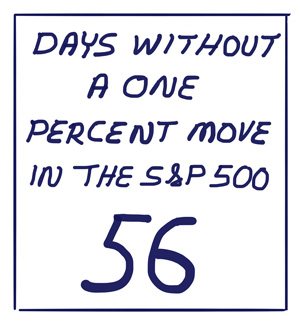
Fast forward to today, and the updated 2018 year-to-date count is 16 days with a drop of at least 1% and 20 days with a gain of at least 1%. Put another way, since April 3, there have only been 11 days when the S&P 500 has closed up or down by more than 1%. The last such day was June 25 when the large-cap index fell by 1.37%.
If the data seems surprising, it’s because we often don’t sense changes in market conditions until after they have occurred—and sometimes not for quite a while afterward. While sharp pullbacks like we experienced in February are very evident, slower evolving trends are not so perceptible. There is rarely an all-clear sign following a period of turbulence, and declines can start subtly before they become noticeable.
The current calm is similar to what we’ve seen over the past several years. Five of the past six calendar years saw the S&P 500 experience fewer than 50 trading days with closing gains or losses greater than 1%. The 72 such moves recorded in 2015 were the most since the rough-and-tumble year of 2011 (which had 96 such days, including 35 days with a gain or drop of at least 2%).
How long the current calm will continue is anybody’s guess. The market is said to climb a wall of worry and there are certainly crevices to watch out for.
The yield curve—which some believe can be an early warning sign of a recession—continues to flatten. As of yesterday, the spread between the two-year and the 10-year Treasury note is just 23 basis points (2.74% versus 2.97%). When I wrote about the flattening yield curve in May, the spread was 51 basis points.
There are ongoing economic and financial rumbles in international markets. China’s economy is facing pressures, particularly slower growth. Various emerging market countries have seen their currencies tumble, including Argentina, Brazil, India and Turkey.
U.S. trade policy continues to evolve, with the potential for additional tariffs being levied by the Trump administration. Trading partners, particularly China, could retaliate in response.
Though these may seem like reasons for concern, they are known risks and should be (at least partially) priced into the market. The same goes for further rate hikes by the Federal Reserve (the CME’s FedWatch Tool calls for quarter-point increases to be announced in about two weeks and again in December) and for the outcome of the November elections (both FiveThirtyEight and PredictIt currently forecast the Democrats to take control of the House of Representatives). At the same time, strong earnings growth, stronger economic growth, tax cuts and the looser regulatory environment are also known and should also be priced into stocks. Collectively, traders and institutional investors are fully aware of the macro backdrop and yet are not acting in a way to excite Mr. Market.
Does this mean volatility will remain low for the foreseeable future? It’s hard to say. Trends only last until they don’t. At some currently unknown date, we’ll see a return of more volatile conditions—it’s part of investing. How you react or, better yet, don’t react will have a far bigger impact on your returns than the future price swings that may occur.

- You Can Judge a Fund by Its Volatility – Though conditions are calm now, actively managed funds with previously high levels of volatility will likely return to being volatile once market conditions change.
- Data Mixed on Whether Volatility Is Rising – When looked at from a longer historical perspective, it isn’t clear that the digital age has altered how volatile the markets are.
- Investor’s Best of the Web 2018 – The most useful websites for analyzing stocks, tracking a portfolio, finding funds and getting information on bonds.
- Do the Top ETFs Continue to Outperform? – Seven years ago, we began tracking the returns of the 10 highest-returning ETFs. Find out what happened to them after we highlighted them.
Nine members of the S&P 500 will report earnings including FedEx Corp. (FDX) and Oracle Corp. (ORCL) on Monday and Micron Technology Inc. (MU) on Thursday.
The week’s first economic report will be the September Empire State Manufacturing Survey, released on Monday. Tuesday will feature the National Association of Home Builders’ September housing market index. August housing starts and building permits will be released on Wednesday. Thursday will feature the September Philadelphia Fed’s business outlook survey and August existing home sales.
The Treasury Department will auction off $11 billion in 10-year Treasury-inflation protected securities (TIPS) on Thursday.
- Why Value Beats Growth: A Brief Explanation
- Actions to Take During the Five Years Prior to Retirement
- Examining the Shadow Stock Value and Size Factors
Optimism among individual investors about the short-term direction of the stock market fell to its lowest level in six weeks. The latest AAII Sentiment Survey also shows a strong rise in pessimism and a rebound in neutral sentiment.
Bullish sentiment, expectations that stock prices will rise over the next six months, plunged 10.1 percentage points to 32.1%. The drop ends a streak of three consecutive weeks with optimism above its historical average of 38.5%. Bullish sentiment was last lower on August 1, 2018 (29.1%).
Neutral sentiment, expectations that stock prices will stay essentially unchanged over the next six months, rebounded by 3.6 percentage points to 35.1%. Neutral sentiment remains above its historical average of 31.0% for the 29th time in 30 weeks.
Bearish sentiment, expectations that stock prices will fall over the next six months, jumped 6.5 percentage points to 32.8%. The increase puts pessimism back above its historical average of 30.5% for the first time in five weeks.
At current levels, all three indicators are well within their typical historical ranges.
Tariffs and the possibility of an escalating trade war remain front and center on the minds of many individual investors. Also influencing sentiment are Washington politics (including President Trump), economic growth, interest rates (including monetary policy), valuations and corporate profits.

Bullish: 32.1%, down 10.1 points
Neutral: 35.1%, up 3.6 points
Bearish: 32.8%, up 6.5 points
Bullish: 38.5%
Neutral: 31.0%
Bearish: 30.5%
Local Chapter Meetings

September 6, 2018 Helpful Steps My Late Father-in-Law Took
August 30, 2018 Despite Problems With Short-Term Thinking, We Should Keep Quarterly Earnings
August 23, 2018 What You Can Expect at the AAII Conference
August 16, 2018 Stock Buybacks Are Being Maligned

