Point 3: Principal Risk of Investing in the Fund
This fund is primarily a stock fund; like all stock investments, it exposes the investor to potential drops in stock prices. In bull markets, this fund's focus on income-producing securities could dampen its performance. Declines occur even in protracted rising markets and share prices of profitable firms can fall. The fund's price will fluctuate, and there is no assurance that shares can be sold at a profit.
What to Look for: The concept of risk is difficult to convey, and there is much disagreement on appropriate measures of risk. But this section must address the risk of the anticipated portfolio holdings and circumstances that will affect the fund's net asset value, yield, and total return. Under this profile point, the fund also has the option to list the types of investors and the types of investment goals for which the fund is most appropriate.
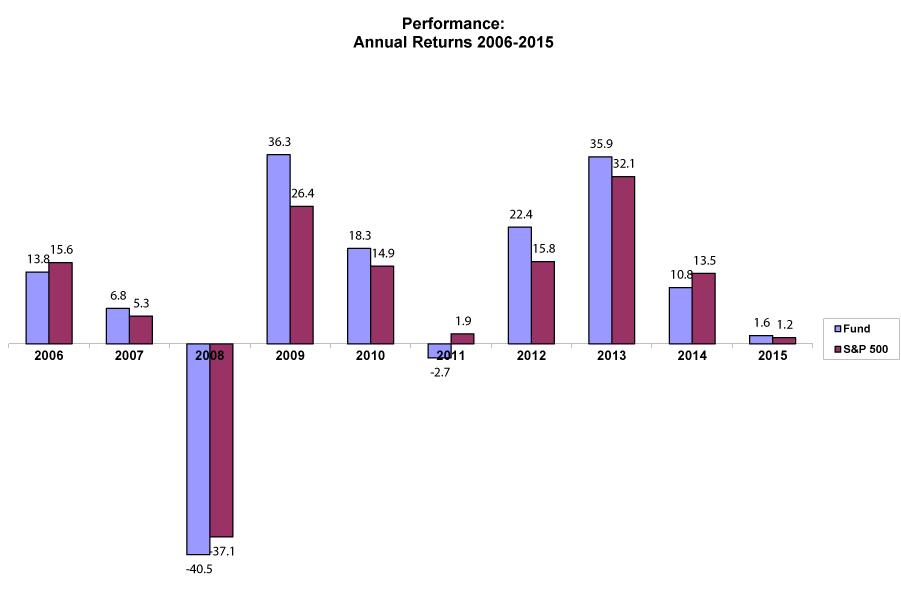
There is nothing like a picture at times to get a thought across. Under the risk section is a bar chart showing the fund's return for each of the last 10 calendar, not fiscal, years (see Figure 1). An accompanying table provides a comparison of compound total annual returns for the last one-, five-, and 10-year periods to an appropriate broad market index (see Figure 2). In addition to the annual bar chart, profiles report the best and worst quarterly returns over the 10 years as a measure of short-term risk. None of the return figures reflect sales loads.
Two impressions should be formed from the risk description and particularly the bar chart. First, see how volatile the returns on this fund are in absolute terms: Are the year-to-year swings more than you can stomach, even though this volatility should be viewed in the context of your overall portfolio? In other words, you need to make a judgment of the absolute risk of this fund and your tolerance for that risk.
Second, examine how volatile this fund is compared to the broad market index on the bar chart: Does this fund have more, less, or the same risk as the broad market, and is its relative risk appropriate to your goals? This goes to the heart of relative risk.
| Average Annual Total Returns (%) | ||
| Fund | S&P 500 | |
| 1 Year |
3.1
|
11.8
|
| 5 Years |
14.1
|
14.4
|
| 10 Years |
6.8
|
6.8
|
| Note: Past performance is not indicative of future performance. Performance figures include the reinvestment of all dividends and any capital gains distributions. All returns are net of expenses. | ||
| The performance data quoted represent past performance. The investment return and principal value of an investment will fluctuate so that investors' shares, when redeemed, may be worth more or less than their original cost. | ||
| * The S&P 500 index is a diversified group of 500 securities used to measure U.S. stock market performance. | ||
Continue to Step 3 »