
Special Note: The $100 Early-Bird discount for this year’s AAII Investor Conference expires tonight. The conference is a great way to hear investment experts and meet fellow investor members. It also regularly sells out, so if you’re considering going, you may want to register now while you can still take advantage of the discount.
Ten companies were expected to complete their initial public offerings this week. Normally, this would be ho-hum news unless it involved a very well-known company. [I doubt Blue Apron (APRN), which went public this morning, has enough name recognition outside of millennials to count as being well-known.] What makes this week notable is that if all 10 deals do price, it would be the busiest week for IPOs in two years, based on data from Dealogic.
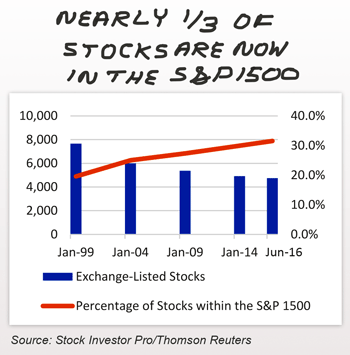 The busy IPO schedule follows a Wall Street Journal column written last week by Jason Zweig discussing an approximate 50% drop in the number of exchange-listed stocks from 1997 until now. We decided to take a closer look at the numbers using our Stock Investor Pro fundamental stock screening and research database program. Those of you who subscribe to our AAII Dividend Investing newsletter may have seen a bit of the analysis we did last week.
We used five-year intervals starting in December 1999 (two years later than Zweig’s starting date), adding in one two-and-half-year cycle to give us present-day data (as of last week). Our analysis also shows a substantial drop, with the number of exchange-listed stocks falling from 7,660 in December 1999 to 4,753 as of last week. Notably, the number of dividend-paying stocks has declined by a far smaller amount: 2,206 in 1999 to 1,963 in 2017.
To the extent that larger companies are more likely to pay dividends than smaller companies, the numbers would suggest it has been the small companies that have disappeared from the stock exchanges. It’s a logical argument, but quantifying it is difficult. Market capitalizations have risen, changing the lines of what divides, say, a mid cap from a small cap. Plus, those boundaries have long been subjective. A percentage breakpoint based on company size doesn’t help either because if the entire universe has shrunk, by definition, the number of companies ranked as the smallest 30% is still equal to the number of companies ranked as the largest 30%. Using composite indexes such as the S&P 1500 (which encompasses the S&P 500, the S&P MidCap 400 and the S&P SmallCap 600) or the Russell 3000 (Russell 1000 and Russell 2000) would require assuming that any decrease in the total number of stocks outside of these indexes is due to a decrease in the absolute number of small companies. A problem with such an assumption is that every time a larger company ceases to be listed (because it is acquired or delisted), both indexes must go down the food chain to maintain a specified number of stocks.
Using the composite indexes does have one advantage, however: It shows the growing proportionate influence of the major indexes. Consider the S&P 500, for instance. In 1999, it encompassed 6.3% of all stocks. Now, slightly more than one out of every 10 exchange-listed stocks (10.5%) is an S&P 500 stock. (Nearly one out of three exchange-listed stocks is now part of the S&P 1500, as the chart above shows.) To the extent institutional investors and mutual funds are required to stay in the S&P 500, Russell 1000 or one of their composite index playgrounds, the market is arguably more efficient. Fewer stocks, more accessible information, greater computing power and growth in financial industry employment all implies that the informational advantage anyone can have by staying within legal and ethical boundaries is much smaller than it used to be.
Even with the ongoing trends, there are still a large of number of stocks outside of the major indexes with comparatively fewer investors looking at them. Even at the lower end of the composite indexes, particularly the Russell 3000, there is less attention being paid. This creates potential opportunities for individual investors to find and invest in mispriced stocks. Behavioral errors such as constantly jumping to the strategy du jour also helps those willing to stay disciplined and think longer term—even when investing in the largest stocks. So while you, an analyst or a money manager are now less likely than ever to uncover something that others have not already figured out, the benefits of having a rules-driven strategy based on quantitative data—not gut instinct, the day’s headlines or a trending story on a website like Seeking Alpha—are arguably greater than ever.
As to why the number of stocks has declined, there are several factors at play. Regulations are blamed as a hurdle to companies going public. (Reuters cited Securities and Exchange Commissioner Jay Clayton as saying the agency is looking into ways to make going public more attractive.) Greater access to venture capital and private equity dollars has reduced the need for some companies to file for initial public offerings (e.g., Uber). Mergers and acquisitions are also playing a role. To the extent that the number of mergers have exceeded the number of IPOs, there are fewer companies outstanding.

- The Case for Systematic Decision-Making – Quantitative approaches work better than humans because they aren’t subject to the influence of behavioral biases.
- The IPO Prospectus: How to Read the Fine Print – Given the number of companies that are going/have gone public this week, I thought it might be helpful to remind you of this 2005 AAII Journal article.
- Piotroski Price-to-Book Screen – AAII President John Bajkowski shows how the F-Score, which analyzes a company’s underlying financial strength, can be used for stocks with high and low price-to-book ratios.
- The Dual Personalities of Investors – Volatility remains historically low, but when turbulence returns to the market, investors should beware of the potential for their personalities to move into a “dark zone.”
The U.S. financial markets will be open on Monday, but closed on Tuesday. The U.S. stock exchanges will close early, 1 p.m. ET, on Monday. Our offices will be closed on both Monday and Tuesday. Have a happy and safe Fourth of July!
There are no S&P 500 companies scheduled to report earnings.
The week’s first economic reports will be June Purchasing Managers’ Manufacturing Index, the June ISM manufacturing index and May construction spending. All three will be released on Monday. Wednesday will feature June’s factory orders as well as the minutes from the June Federal Open Market Committee meeting. On Thursday, the June ADP Employment Report, May international trade data and the June ISM non-manufacturing index will be released. Ending the week, on Friday, will June employment data, including the change in nonfarm payrolls and the unemployment rate.
Two Federal Reserve officials will make public appearances. St. Louis president James Bullard will speak on Monday and San Francisco president John Williams will speak on Thursday.
- Piotroski Price-to-Book Screen
- The Role of REITs for Long-Term Investors
- Rules for Drawing and Analyzing Trendlines
The percentage of individual investors describing their outlook for stocks as neutral is at its highest level in nearly a year. The latest AAII Sentiment Survey also shows pessimism at its lowest level since the first week of January.
Bullish sentiment, expectations that stock prices will rise over the next six months, declined 2.9 percentage points to 29.7%. This is a six-week low. It is also the 18th consecutive week and the 23rd time out of the last 24 weeks that bullish sentiment is below the historical average of 38.5%.
Neutral sentiment, expectations that stock prices will stay essentially unchanged over the next six months, jumped by 5.0 percentage points to 43.4%. The last time neutral sentiment was this high was August 3, 2016 (also 43.4%). This week’s rise keeps neutral sentiment above its historical average of 31.0% for the ninth consecutive week and the 14th out of the last 15 weeks.
Bearish sentiment, expectations that stock prices will fall over the next six months, declined 2.1 percentage points to 26.9%. Pessimism was last lower on January 4, 2017 (25.2%). The drop keeps bearish sentiment below its historical average of 30.5% for the seventh out of the last nine weeks.
At current levels, neutral sentiment is at an unusually high level (more than one standard deviation above its historical average). Optimism, though slightly below 30%, continues to remain within its typical range (albeit, near the lower end of it).
This year’s record highs for the S&P 500 and the Nasdaq have encouraged some individual investors, but the Trump administration’s ability (or lack thereof) to move forward on economic and tax policy remains on the forefront of many others’ minds. Also playing a role in influencing sentiment are earnings, valuations, concerns about the possibility of a pullback in stock prices and interest rates/monetary policy.
This week’s special question asked AAII members for their current opinion of health care stocks. Two out of every five respondents (40%) expressed a positive opinion. Some respondents said health care stocks are currently attractive, while others pointed to their long-term prospects. Nearly a quarter of all respondents (24%) said they are currently uncertain or otherwise cautious about health care stocks. Some of these respondents directly mentioned the policy debates occurring in Washington, D.C. Almost 21% said they are negative on health care stocks. High valuations were listed by some, while others cited the current uncertainty.
Here is a sampling of the responses:
- “Good if you are in it for the long run. There are so many of us old folks who will need medical care of some sort.”
- “They will rise in the long term, but will be volatile in the short term.”
- “Health care stocks will twist in the wind until Congress gets its act together on health care legislation.”
- “They have run up in price too far, too fast.”
- “Good now; need to see what Congress and the president will do.”

Bullish: 29.7%, down 2.9 points
Neutral: 43.4%, up 5.0 points
Bearish: 26.9%, down 2.1 points
Bullish: 38.5%
Neutral: 31.0%
Bearish: 30.5%
Local Chapter Meetings

June 22, 2017 Don’t Like Volatility? Take a Longer-Term View
June 16, 2017 Is It Active or Passive?
June 8, 2017 Invest, Exceed Goal, Then Stop Taking Risk
June 1, 2017 Dividends and Buybacks Drive Stock Returns

