


Related

First Cut Stocks
High-quality REITs can deliver consistent, rising growth in funds from operations, dividends and asset value over reasonably long periods of time.
by Brad Thomas | November 2022

One of the key themes in my book “The Intelligent REIT Investor Guide” (Wiley, 2021) is to understand how some of the highest-quality real estate investment trusts (REITs)—called “blue chips”—are differentiated from the others. Unfortunately for investors, “there is no objective or commonly accepted definition of a blue-chip REIT.” You won’t find it in Merriam-Webster’s dictionary no matter how hard you look.
So, I decided that I would compile the below list. This list was originally sourced from my friend, Ralph Block, whom I also tributed my book to. Blue-chip REITs have certain qualities that set them apart, such as:
As I explain in my book, “a blue-chip REIT doesn’t have to exhibit all those attributes at once. But it will have most of them.”
With the coronavirus sell-off in 2020, I was able to capitalize on the mispricing to invest in a number of blue-chip REITs such as Realty Income Corp.  (O), Essex Property Trust Inc. (ESS) and National Retail Properties Inc. (NNN)—all of which are Dividend Aristocrats [companies that have increased their dividends every year for at least 25 years].
These days, as the pandemic is in the rearview mirror and folks are getting around a lot more (and using more real estate), shares in most REITs are trading above their pandemic lows. Which, of course, leads me to the most important concept in my book, “the margin of safety.”
If you haven’t figured it out yet, I purposely titled my book after the legendary value investor Benjamin Graham’s masterpiece, “The Intelligent Investor.” In this classic (I recommend everyone read it), Graham discusses the “margin of safety” concept: “The margin of safety is always dependent on the price paid. It will be large at one price, small at some higher price, nonexistent at some still higher price.”
REITs are unique to ordinary stocks. Investors analyzing common stocks generally use net income as a key measure of profitability, but the custom in the REIT world is to use funds from operations (FFO). The historical preference for FFO rather than net income relates to the concept of depreciation.
Net income figures for a REIT are less meaningful as a measure of operating success than they are for other types of companies. The reason for this is that, in accounting, real estate depreciation is always treated as an expense. In the real world, not only have most properties retained their value over the years (at least those that are well-maintained and competitive), but many have appreciated substantially.
This means that a REIT’s net income reflects a large depreciation expense, so most investors prefer to use funds from operations, which adds depreciation back to net income under generally accepted accounting principles (GAAP).
When calculating FFO, there are other adjustments that should be made as well, such as subtracting any capital gains income on the sale of properties from GAAP net income (Figure 1).
Figure 1. Calculating Funds From Operations (FFO)

The reason for this is that the REIT can’t have it both ways. In figuring FFO, a REIT cannot ignore depreciation—which reduces a property’s carrying costs on the balance sheet—and then include the capital gains from selling that property above the price at which it has been carried.
Most REITs and their investors believe the concept of FFO is more useful than net income as a device to measure profits. Although FFO is used almost universally in the REIT world, there are a number of problems with it. They include deprecation not properly accounting for the costs of property improvements and structural replacements (like a roof) and the capitalization expenses that should be considered as part of ordinary property maintenance.
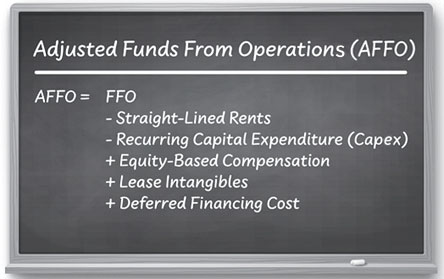
To solve the problems with FFO, most investors prefer to stick with adjusted funds from operations (AFFO). AFFO takes FFO and adjusts for expenditures that, though capitalized, don’t enhance property value. It also eliminates rent straight-lining, a GAAP practice that smooths out rental increases but, in the process, can make past rents seem higher than they actually were. By making these adjustments, AFFO provides a measure of a REIT’s operating performance. AFFO is a fairly effective tool to measure free cash generation and the ability to pay dividends.
Keep in mind that AFFO is not a metric included in GAAP. Therefore, it is not regularly reported by REITs due to the lack of a single commonly accepted definition. It’s also subjective—an investor or analyst must calculate it on their own by reviewing financial statements. A simplified version is shown in Figure 2.
Figure 2. Calculating Adjusted Funds From Operations (AFFO)
It’s important to use FFO and AFFO when valuing a REIT and not to use ordinary earnings. One of the most common mistakes that I see investors make is trying to use the price-earnings (P/E) ratio when they should be using the price-to-FFO ratio or the price-to-AFFO ratio.
Typically, a REIT’s price-to-AFFO ratio is higher when the company is a growth stock. For example, American Tower Corp. (AMT), a leading cell tower REIT, is forecasted to grow AFFO per share by 9% in 2023 and shares trade at around 28 times price to AFFO.
Alternatively, a slower grower like Easterly Government Properties Inc. (DEA) that invests in government-lease buildings is forecasted to grow earnings by just 4% in 2023 and is trading at 16.1 times price to AFFO.
Another example is a negative grower like Omega Healthcare Investors Inc. (OHI), a skilled nursing REIT that is forecasted to have earnings fall by 12% in 2022 and then grow by 5% in 2023. Needless to say, Mr. Market has discounted shares in this stock, which trades at a price-to-AFFO multiple of 11.5 times.
One of the great things about REITs today is the fact that there are so many different property sectors to invest in. I just highlighted cell towers, government-leased and skilled nursing, but there are many “flavors” to consider—using the Baskin-Robbins analogy.
One such sector that has become extremely volatile is cannabis, which has seen growth accelerated by the number of states that are legalizing products. Federal banking is still not allowed and remains difficult, which has created the opportunity for REITs.
Innovative Industrial Properties Inc. (IIPR) is an NYSE-listed cannabis REIT that grew AFFO per share by over 50% in 2020 and 33% in 2021. In these years, sentiment followed as the REIT returned 150% (in 2020) and 47% (in 2021); however, 2022 has been a bust.
Shares in the company have returned negative 60% year to date, signaling a slowdown in growth and possibly worse. Analysts are forecasting growth of around 10% in 2022 and 2023, which is still solid for a REIT, while the price-to-AFFO multiple is just 13.3 times.
What this tells you is that when you buy Innovative Industrial Properties you are getting cell tower–like growth (AMT) for skilled nursing–type value (OHI).
A final example I’ll touch on is gaming, an interesting property sector that has been an exceptional category for value creation.
VICI Properties Inc. (VICI) invests in casinos and leases to operators such as MGM Resorts International (MGM) and Caesars Entertainment Inc. (CZR). VICI Properties trades at 18.4 times price to AFFO with 5% growth forecasted in 2023.
Blue-chip real estate investment trusts (REITs) have certain qualities that set them apart. While a REIT does not have to exhibit every attribute at once, it will have most of them. Those traits are:
Now to be clear, American Tower is the only so-called blue-chip name that I’ve referenced, so I wanted to provide you with one additional example to show you that you can find such characteristics among lesser-known names.
Federal Realty Investment Trust (FRT) is a textbook blue-chip REIT in my book. The shopping center landlord has paid and increased dividends for over 54 years in a row and is the “only” Dividend King in the REIT-dom. (A Dividend King is a company that has paid and increased dividends for over 50 years in a row.)
The company has a fortress balance sheet (A-rated by S&P)—approximately $1.2 billion of total liquidity with an undrawn $1 billion revolving credit facility and $177 million of cash. Shares were trading at 24.1 times price to AFFO with a dividend yield of 3.9% at the time I wrote this.
Moreover, analysts are forecasting 8% growth in 2022 and 2023.
In terms of quality, Federal Realty stands out. Given the forward-looking estimates, this REIT has traits associated with what one would use to expect good future returns.
Just like every other investment, blue-chip REITs are subject to sector-specific ups and downs here and there. However, they deliver consistent, rising growth in funds from operations, dividends and asset value over reasonably long periods of time. Because blue-chip REITs are financially strong and widely respected, they also tend to have access to additional equity and debt capital that can fuel above-average growth.
Hopefully, this overview provides you with a basic understanding of REITs and the importance of adhering to the time-tested methods of quality and value. As Benjamin Graham observed:
“The function of the margin of safety is, in essence, that of rendering unnecessary an accurate estimate of the future. If the margin is a large one, then it is enough to assume that future earnings will not fall far below those of the past in order for an investor to feel sufficiently protected against the vicissitudes of time.”
First Cut Stocks

Portfolio Strategies


Philip D from CA posted over 3 years ago:
MANJUNATH S from CA posted over 3 years ago:
DAVE G from TX posted over 3 years ago:
You need to log in as a registered AAII user before commenting.
Log InCreate an account