
This week, we use AAII’s A+ Investor Stock Grades to provide insight into three energy equipment and services stocks. With exponential demand for digital modernization and renewable integration in the energy industry, should you consider the energy equipment and services stocks of Natural Gas Services Group Inc. ![]() (NGS), Precision Drilling Corp.
(NGS), Precision Drilling Corp. ![]() (PDS) and TechnipFMC PLC
(PDS) and TechnipFMC PLC ![]() (FTI)?
(FTI)?
Energy Equipment and Services Stocks Recent News
The energy equipment and services industry is undergoing significant transformation, propelled by rising demand for grid modernization, renewable integration and digital service models. According to Market Research Future (MRFR), the global energy equipment service market is projected to reach $808.9 billion by 2034, up from $500.3 billion in 2024, reflecting a 4.9% compound annual growth rate (CAGR). MRFR expects the energy engineering service outsourcing market to expand from $584.6 billion in 2023 to $1.0 trillion by 2032, growing at a 6.4% CAGR. Precedence Research estimates the market size of global power quality equipment, critical to grid reliability, at $41.1 billion in 2025 and forecasts it to reach $71.5 billion by 2034, a 6.4% CAGR. Industrial electrification services are also gaining momentum globally, expected by Precedence Research to grow from $44.0 billion in 2024 to $95.8 billion by 2034, representing an 8.1% CAGR.
Technological advancements are reshaping operations across transformers, turbines, pumps and compressors. MRFR projects the global energy equipment service market—which includes gas turbines, steam turbines and generators—to grow at a 4.9% CAGR through 2034, driven by the adoption of monitoring enabled by Internet of Things (IoT), predictive diagnostics and retrofitting services. Regional dynamics for energy equipment services show North America leading in market share, while Asia-Pacific is the fastest-growing region, according to MRFR. Broader trends—including longer lead times for gas infrastructure builds, growing demand for energy as a service (EaaS) and mounting pressure for sustainability—are accelerating investments in digital, life-cycle-based service models. Precedence Research expects the EaaS segment alone to more than double over the next decade—growing from $84.7 billion in 2025 to $189.3 billion by 2034, a 9.4% CAGR.
Sign Up to Receive a Free Special Report That Shows How A+ Investor Grades Can Help You Make Investment Decisions
Grading Energy Equipment and Services Stocks With AAII’s A+ Stock Grades
When analyzing a company, it is helpful to have an objective framework that allows you to compare companies in the same way. This is why AAII created the A+ Stock Grades, which evaluate companies across five factors that research and real-world investment results indicate to identify market-beating stocks in the long run: value, growth, momentum, earnings estimate revisions (and surprises) and quality.
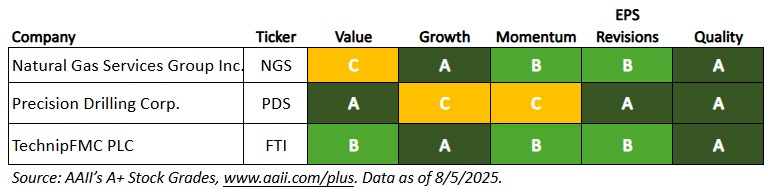
Using AAII’s A+ Stock Grades, the following table summarizes the attractiveness of three energy equipment and services stocks—Natural Gas Services, Precision Drilling and TechnipFMC—based on their fundamentals.
AAII’s A+ Stock Grade Summary for Three Energy Equipment and Services Stocks
What the A+ Stock Grades Reveal
Natural Gas Services Group Inc. ![]() (NGS) is a provider of natural gas compression equipment and services for the oil and gas industry. The company operates through two primary segments: rental, which offers a fleet of natural gas compressors for use in oil and gas production, and sales, which designs, fabricates and sells custom-built compression units. Natural Gas Services supports exploration and production companies across the U.S., with a focus on major shale basins including the Permian Basin, the Eagle Ford Group and the Marcellus Formation. The company emphasizes reliability, service responsiveness and operational efficiency to maintain strong customer relationships, while pursuing disciplined capital investments to support fleet modernization and growth. Natural Gas Services was founded in 1998 and is headquartered in Midland, Texas.
(NGS) is a provider of natural gas compression equipment and services for the oil and gas industry. The company operates through two primary segments: rental, which offers a fleet of natural gas compressors for use in oil and gas production, and sales, which designs, fabricates and sells custom-built compression units. Natural Gas Services supports exploration and production companies across the U.S., with a focus on major shale basins including the Permian Basin, the Eagle Ford Group and the Marcellus Formation. The company emphasizes reliability, service responsiveness and operational efficiency to maintain strong customer relationships, while pursuing disciplined capital investments to support fleet modernization and growth. Natural Gas Services was founded in 1998 and is headquartered in Midland, Texas.
Natural Gas Services has a Momentum Grade of B, based on its Momentum Score of 78. This means that the stock’s momentum is strong in terms of its weighted relative price strength over the last four quarters. The weighted four-quarter relative strength rank is the relative price change for each of the past four quarters, with the most recent quarterly price change given a weight of 40% and each of the three previous quarters given a weight of 20%. The ranks are 79, 21, 91 and 60, sequentially from the most recent quarter. The weighted four-quarter relative price strength is 6.7%.
A higher-quality stock possesses traits associated with upside potential and reduced downside risk. Backtesting of the Quality Grade shows that stocks with higher grades, on average, outperformed stocks with lower grades from 1998 through 2019.
The A+ Quality Grade is the percentile rank of the average of the percentile ranks of return on assets (ROA), return on invested capital (ROIC), gross profit to assets, buyback yield, change in total liabilities to assets, accruals to assets, Z double prime bankruptcy risk (Z) score and F-Score. The score is variable, meaning it can consider all eight measures or, should any of the eight measures not be valid, the valid remaining measures. To be assigned a Quality Score, though, stocks must have a valid (non-null) measure and corresponding ranking for at least four of the eight quality measures.
Natural Gas Services has a Quality Grade of A, based on a score of 91, which is very strong. The company ranks strongly in terms of its return on invested capital and its F-Score. Its return on invested capital is 75.8%, ranking in the 92nd percentile among all U.S.-listed stocks. Its F-Score of 7 ranks in the 85th percentile. The F-Score is a number between 0 and 9 that assesses the strength of a company’s financial position based on its profitability, leverage, liquidity and operating efficiency. Natural Gas Services also has a return on assets of 3.4%.
The components of the Growth Composite Score consider a company’s success in growing sales on a year-over-year and long-term annualized basis and its ability to consistently generate positive cash from its core operations. Natural Gas Services’ Growth Grade is A, which is very strong. The company has generated positive annual cash from operations in the past five consecutive years and has a five-year annualized sales growth rate of 14.9%.
Precision Drilling Corp. ![]() (PDS) is a Canadian-based provider of onshore drilling, completion and production services to exploration and production companies in the oil, natural gas and geothermal sectors. The company operates through two main segments. The contract drilling services segment delivers high-efficiency Super Series land drilling rigs and complementary services, including equipment procurement, rig fabrication and repair, enhanced by its proprietary Alpha automation and analytics platform and EverGreen environmental solutions. The completion and production services segment includes service rigs for well completion, workovers, abandonment and maintenance, rental equipment, and camp and catering services. Precision Drilling serves clients across North America and select international markets such as the Middle East. The company emphasizes operational excellence, digital innovation and environmental responsibility, and it supports growth through disciplined capital allocation, including debt reduction and shareholder-focused buybacks. Precision Drilling was founded in 1951 and is headquartered in Calgary, Alberta.
(PDS) is a Canadian-based provider of onshore drilling, completion and production services to exploration and production companies in the oil, natural gas and geothermal sectors. The company operates through two main segments. The contract drilling services segment delivers high-efficiency Super Series land drilling rigs and complementary services, including equipment procurement, rig fabrication and repair, enhanced by its proprietary Alpha automation and analytics platform and EverGreen environmental solutions. The completion and production services segment includes service rigs for well completion, workovers, abandonment and maintenance, rental equipment, and camp and catering services. Precision Drilling serves clients across North America and select international markets such as the Middle East. The company emphasizes operational excellence, digital innovation and environmental responsibility, and it supports growth through disciplined capital allocation, including debt reduction and shareholder-focused buybacks. Precision Drilling was founded in 1951 and is headquartered in Calgary, Alberta.
The company has a Value Grade of A, based on its Value Score of 99, which is deep value. The Value Grade is the percentile rank of the average of the percentile ranks of the price-to-sales (P/S) ratio, price-earnings (P/E) ratio, price-to-book-value (P/B) ratio, price-to-free-cash-flow (P/FCF) ratio, shareholder yield and the ratio of enterprise value to earnings before interest, taxes, depreciation and amortization (EBITDA).
The company has a price-earnings ratio of 10.5, ranking in the 22nd percentile among all U.S.-listed stocks. Its enterprise-value-to-EBITDA ratio is 3.9, ranking in the 8th percentile. Precision Drilling’s shareholder yield of 6.5% ranks in the 11th percentile and is above the sector median of 1.6%.
Earnings estimate revisions indicate how analysts view a firm’s short-term prospects. Precision Drilling has an Earnings Estimate Revisions Grade of A, based on a score of 81, which is very positive. The grade is based on the statistical significance of its latest two quarterly earnings surprises and the percentage change in its consensus estimate for the current fiscal year over the past month and past three months.
Precision Drilling reported a positive earnings surprise of 22.9% for the first quarter of 2025. Over the last month, the consensus earnings estimate for the third quarter of 2025 has increased from $0.92 to $0.98 per share based on two upward revisions. Over the last month, the consensus earnings estimate for full-year 2025 has increased from $4.14 to $4.93 per share based on three upward revisions.
Precision Drilling has a Growth Grade of C, which is average. The company has a five-year annualized sales growth rate of 2.2%, compared to the sector median of 5.9%. It has generated positive annual cash from operations in the past five consecutive years.
Don’t Miss Your Free Report — Sign Up Here!
TechnipFMC PLC ![]() (FTI) is a U.K.-domiciled global technology provider for the energy sector, offering integrated products, systems and services to both traditional and emerging energy markets. The company operates through two main segments. The subsea segment delivers comprehensive subsea production and processing systems including subsea trees, flexible pipes, umbilicals, risers, flowlines, vessels, robotics and life of field services, supported by its iEPCI, iFEED and Subsea Studio digital platforms. The surface technologies segment designs, manufactures and services land and shallow water equipment such as surface wellheads, pressure control systems, fracturing trees and manifolds, flowback and testing systems, measurement and automation solutions, and skid-mounted separation and pumping units. TechnipFMC serves energy companies across the Americas, Europe, Asia, Africa and the Middle East, focusing on project integration, digital innovation and emissions reduction technologies. The company supports growth through strategic partnerships and operational excellence. TechnipFMC was formed in 2017 through the merger of FMC Technologies Inc. and Technip S.A. It is headquartered in Houston, Texas, with its legal domicile in Newcastle upon Tyne, England.
(FTI) is a U.K.-domiciled global technology provider for the energy sector, offering integrated products, systems and services to both traditional and emerging energy markets. The company operates through two main segments. The subsea segment delivers comprehensive subsea production and processing systems including subsea trees, flexible pipes, umbilicals, risers, flowlines, vessels, robotics and life of field services, supported by its iEPCI, iFEED and Subsea Studio digital platforms. The surface technologies segment designs, manufactures and services land and shallow water equipment such as surface wellheads, pressure control systems, fracturing trees and manifolds, flowback and testing systems, measurement and automation solutions, and skid-mounted separation and pumping units. TechnipFMC serves energy companies across the Americas, Europe, Asia, Africa and the Middle East, focusing on project integration, digital innovation and emissions reduction technologies. The company supports growth through strategic partnerships and operational excellence. TechnipFMC was formed in 2017 through the merger of FMC Technologies Inc. and Technip S.A. It is headquartered in Houston, Texas, with its legal domicile in Newcastle upon Tyne, England.
TechnipFMC has a Quality Grade of A, based on a score of 88, which is very strong. The company ranks strongly in terms of its return on assets and buyback yield, which rank in the 87th and 88th percentiles, respectively. TechnipFMC’s return on invested capital of 32.9% ranks in the 77th percentile.
The company has a Value Grade of B, based on a score of 65, which is good value. A lower price-to-free-cash-flow ratio is considered better value. TechnipFMC’s price-to-free-cash-flow ratio of 11.5 ranks in the 29th percentile and is below the sector median of 14.3. Its enterprise-value-to-EBITDA ratio of 8.8 ranks in the 30th percentile. The company’s price-earnings ratio of 16.4 ranks in the 43rd percentile and is above the sector median of 12.7.
TechnipFMC has a Momentum Grade of B, based on its Momentum Score of 73. This means that the stock’s momentum is strong in terms of its weighted relative price strength over the last four quarters. The ranks are 73, 58, 78 and 42, sequentially from the most recent quarter. The weighted four-quarter relative price strength is 4.0%.
 Included With AAII Platinum
Screen: 23.7%
Annual Gain Since Inception. Data as of 12/31/2024.
769.3% Stock Superstars Portfolio Total Return Since Inception

U.S. Index ETF (IYY)
SSR Group 3 O'Shaughnessy portfolio has a 411.2% gain since inception performance compared to IYY at only 119.1%% Performance as of 11/29/24.


FREE REPORT

BECOME A MEMBER FOR ONLY $2
Get access to powerful investment discovery tools and a wealth of investment education to help you achieve your financial goals.