

A Checklist Can Make You a Better Investor
by Charles Rotblut | April 26, 2018
In discussing how his company responded to last week’s engine failure on flight 1380, Southwest Airlines CEO Gary Kelly was quoted by The Wall Street Journal as saying, “Everybody has a checklist.”
Checklists have been shown to work across a variety of fields, including aviation, health care, construction and, yes, investing. Value investors Guy Spier and Mohnish Pabrai are known for their use of checklists. The basis for Pabrai’s checklist is the mistakes he and other great investors—including Warren Buffett and Charlie Munger—have made. Pabrai includes everything he needs to consider when analyzing a company on his checklist. 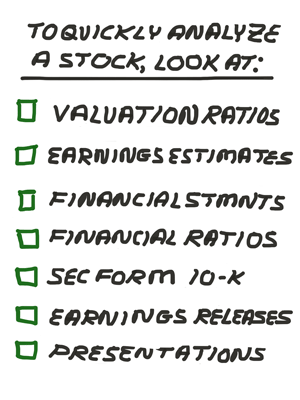
A checklist will not magically make you a better investor, but it will help. A checklist is a means for reminding a person to follow a disciplined process. It details every step that needs to be taken so nothing is unintentionally overlooked. For example, an investment professional discussed in Atul Gawande’s book, “The Checklist Manifesto: How to Get Things Right” (Metropolitan Books, 2009), requires his staff to check off that they’ve read the footnotes to a company’s cash flow statement. Another item on this investor’s checklist is to confirm that the statement of key management risks—found on a company’s 10-K filing with the U.S. Securities and Exchange Commission (SEC)—has been read.
Depending on how varied your portfolio is and how complicated your finances are, you may need several checklists. That’s okay. Your goal is to list all of the steps necessary to complete a certain task such as analyzing a potential investment or determining when your portfolio’s allocation should be adjusted. The role of a checklist is to remind you what steps you should be taking and help ensure that you complete each necessary task.
In the current market environment, a checklist can prevent you from having a kneejerk reaction to the day’s headlines and volatility. It forces you to slow down and work through your process.
As far as what should go on your checklist, the answer will depend on your investment strategy. For those of you who invest in individual stocks, a starting point is a list I shared last July about how to quickly analyze a stock. I’m republishing it this week (with some small revisions) because it is a tangible example you can build upon.
• Valuation Ratios: Look at the valuation to ensure you are not overpaying. Lower valuation ratios (price-earnings, price-to-book, price-to-sales, price-to-cash flow, etc.) are better than higher ones. Very high price-earnings and price-to-book ratios can also signal low levels of earnings or book value, respectively.
• Earnings Estimates: Look to see if analysts are raising their forecasts (good) or cutting them (bad). Also, check to see if the company is beating forecasts or missing them. Finally, check growth. Are earnings projected to rise or fall?
• Financial Statements: There is no substitute for looking at the financial statements. Not just for the current year, but for past years. Five to seven years will give you a good idea of the growth trends in sales, profits, cash flows and dividends. Start with the income statement and then go to the cash flow statement. Look to see if cash from operations is consistently positive (it’s a negative sign if it isn’t) and whether it’s greater than income after taxes. (If operating cash flow is smaller, the company is being aggressive with its use of accruals and is at greater risk of writing down earnings in the future.) Scroll down the cash flow statement to, or calculate, free cash flow (cash from operations less capital expenditures). Free cash flow should be positive for most years. Finally, glance at cash from financing. Positive numbers for cash from financing indicate that the company has raised cash either through debt or by selling stock. Jump over to the balance sheet and compare shareholder equity to total liabilities; disproportionately high liabilities imply that the company is laden with debt.
• Financial Ratios: Review the trend in key ratios. Gross and operating margins will quickly tell you if the company is becoming more or less profitable. Rising asset turnover ratios are a sign of improving efficiency. Companies using share buybacks to reduce the net number of shares outstanding will have positive buyback yields. The payout ratio will reveal if the dividend is sustainable.
• 10-K: Read the 10-K, an annual filing required by the SEC. You can locate it, and other regulatory filings, on EDGAR. Scan through it to understand what the company does and what its potential risks are. If something seems suspicious or otherwise not right (especially in the footnotes), trust your gut and find a different stock to invest in.
• Earnings Releases: I find it helpful to look at the 10-K first or in conjunction with the earnings statement. This is particularly the case if the company’s executives are using internal or industry lingo. Determine how the company has performed, the reasons for the performance and what the executives expect to happen in the foreseeable future. You’ll find the earnings releases on a company’s investor relations website. You may also find it useful to read the conference call transcript, which can be found on Seeking Alpha (call up the quote page for the stock and then click on “earnings”).
• Presentations: Many companies publish slides from their presentations on their investor relations websites [thank the SEC’s Regulation Fair Disclosure (“Reg FD”) for this]. Scan through the slides to get a good overview of the business and what trends management is seeing.

-
Nine Rules for Smarter Investing – These are the rules that value fund manager Guy Spier follows as part of his investment process.
-
Using a Simple Worksheet to Analyze a Stock – This Investor Classroom lesson includes an easy-to-follow valuation worksheet to systematically determine whether a stock is cheap, fairly valued or expensive.
Pessimism among individual investors about the short-term direction of stock prices is at a six-week low according to the latest AAII Sentiment Survey. This week’s survey also shows higher neutral sentiment and lower optimism.
Bullish sentiment, expectations that stock prices will rise over the next six months, declined by 0.9 percentage points to 36.9%. Optimism is below its historical average of 38.5% for the ninth consecutive week and the 10th time in 12 weeks.
Neutral sentiment, expectations that stock prices will stay essentially unchanged over the next six months, jumped 4.5 percentage points to 37.5%. Neutral sentiment is above its historical average of 31.0% for the 10th consecutive week.
Bearish sentiment, expectations that stock prices will fall over the next six months, fell 3.7 percentage points to 25.6%. Pessimism was last lower on March 14, 2018 (21.3%). The historical average is 30.5%.
At current levels, all three indicators are within their typical historical levels.
Many individual investors, but not all, anticipate continued volatility and/or think that the current political backdrop could have a further impact on the stock market. Trade policy is influencing some individual investors’ sentiment. While many individual investors either approve of the Federal Reserve’s plan to gradually raise interest rates or don’t expect it to affect the stock market, some are concerned about the impact that rising rates will have. Also influencing sentiment are valuations, tax cuts, earnings and economic growth.
This week’s special question asked AAII members what they think is the biggest threat that the U.S. market will face between now and the end of the year. Responses varied. Higher inflation and interest rates are listed by 18% of respondents. President Donald Trump is also cited by 18% of respondents. Comments about the president reference his tweets, policy shifts and the possibility of him being removed from office. The midterm elections and the possibility of a change in congressional leadership are cited by 6% of respondents.
Nearly 12% point to tariffs and the possibility of a trade war. Slightly more than 9% of respondents describe geopolitical unrest and the possibility of military conflict as threats. Some members list more than one threat.
Here is a sampling of the responses:
- “Rising interest rates and continued political and international instability.”
- “The unsettled local and geopolitical environments.”
- “The risk of the president causing a trade war.”
- “Domestic politics, including the midterm elections and impeachment.”
- “An unanticipated event such as war, a spike in inflation or political upheaval.”

Bullish: 36.9%, down 0.9 points
Neutral: 37.5%, up 4.5 points
Bearish: 25.6%, down 3.7 points
Bullish: 38.5%
Neutral: 31.0%
Bearish: 30.5%
April 19, 2018 Guidelines for Projecting Retirement Savings
April 12, 2018 How Much Is a Lottery Ticket Worth?
April 5, 2018 Keep Calm and Ignore the Market’s Volatility
March 29, 2018 An Argument for Favoring the Loser Over the Winner Funds

Discussion
No comments have been added yet. Add your thoughts to the discussion!
You need to log in as a registered AAII user before commenting.
Create an account