

Is Now a Good Time to Invest in Stocks?
by Charles Rotblut | January 05, 2017
One of the most common questions many of us in the investment community are asked can be paraphrased as “is now a good time to invest in stocks?” The answer to this question consists of two parts. The first is a clarifying question: “When will you need the money?” The second, depending on the response to the first, is either “no, given your time horizon” or “yes, as long as you’re willing to stick with your investment strategy.”
The reason for first asking about when you the need money is to assess your ability to withstand a short-term loss. The market ebbs and flows. On any given week, month or year, stocks can be up or down. Short investing horizons can lack the necessary time needed to recover from a stumbling Mr. Market. This is why money needed within two years (and up to four or five years for conservative investors) should not be invested in stocks.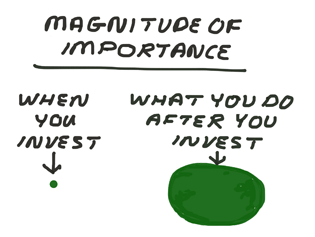
The math changes for money not needed for longer time periods. Since 1926, large-cap stocks have risen during 86% of all rolling five-year periods according to the Ibbotson SBBI Yearbook (Duff & Phelps, 2016). Extend the time period out to 10 years, and large-cap stocks have risen 95% of the time. These numbers include the Great Depression, World War II, the 1970s’ stagflation, the 1987 crash and the 2008 financial crisis, among other bad periods. This is food for thought for those of you who are worried about allocating to stocks right now because of valuations, the extent of the recent rally, the Fed, the Trump administration, terrorism, etc.
Since some of you may prefer figures based on more recent history, I ran the numbers assuming that someone got into the market shortly before each of the last two bear markets. A person who bought shares in the Vanguard 500 Index fund (VFINX) at the start of 2000 would have realized a profit on their investment by 2006. Move the start date up to January 2007 and the same investor would have realized a profit by 2012. Both scenarios assume a buy-and-hold investment was made solely in the S&P 500 index fund with no other action taken. Note that the second example assumes an investor got into the market just before the worst bear market since World War II started.
There are many in the investment profession who would instead answer the question of “is now a good time to invest?” with analyses of valuation ratios, economic data, technical analysis and the like. (I have been guilty of doing this as well.) The detailed analyses and well-thought-out forecasts can provide comfort to the psyche of the person who is trying to decide whether or not to buy stocks right now. Rather than relying on analyses and forecasts to make decisions, I would encourage you instead to simply take a deep breath and invest if your goal is to increase your wealth over a time span of, say, five years or longer. You will be far more likely to realize a positive return on your investment by doing so then by relying on predictions of what Mr. Market might do.
Plus—and this is an extremely important point—what you do after you invest matters far more than when you invest. Analyses by Morningstar and analytics firm DALBAR show that investors commonly realize returns that are lower than the actual funds they invest in. The reason is simple: bad timing decisions. Investors too often think they know when to get in and out of the market. Most investors would do much better by simply buying a low-cost, broad market index fund and not looking at their account for several years.
If you’re still nervous about getting into the market today, next week or on any other given day after having read this week’s commentary, there are two things you can do. First, pull out a calendar, circle one day three months from now, six months from now, nine months from now and 12 months from now (or any time interval you feel comfortable with). Then invest a portion today and a bit more on each of the future days regardless of what is occurring on each particular day. Second, diversify among various asset classes, such as bonds and real estate investment trusts (REITs). The first step will reduce the odds of investing on a suboptimal day. The second step will reduce the volatility of your portfolio, allowing you to stick with your strategy for a longer period of time.

-
First Steps to Successful Investing – This AAII Investor Classroom lesson explains how to set up a personal investment strategy.
-
A Lifetime Investment Strategy – AAII founder and chairman Jim Cloonan’s guidelines for the long-term successful management of your stock portfolio.
Optimism among individual investors is starting 2017 at a six-week high, according to the latest AAII Sentiment Survey. The rise in optimism comes as both neutral and bearish sentiment declined modestly.
Bullish sentiment, expectations that stock prices will rise over the next six months, rose 0.6 percentage points to 46.2%. Optimism was last higher on November 23, 2016 (49.9%). The rise keeps bullish sentiment above 40% for an eighth consecutive week and above its historical average of 38.5% for a ninth consecutive week.
Neutral sentiment, expectations that stock prices will stay essentially unchanged over the next six months, declined 0.1 percentage points to 28.6%. This is the fifth consecutive week and the seventh time in eight weeks that neutral sentiment is below its historical average of 31.0%.
Bearish sentiment, expectations that stock prices will fall over the next six months, declined 0.5 percentage points to 25.2%. This is a five-week low; pessimism was last lower on November 30, 2016 (25.1%). The decline also keeps bearish sentiment below its historical average of 30.5% for the eighth time in nine weeks.
All three sentiment measures are starting the new year within their typical historical ranges. The optimism shared by many, but not all, investors extends a shift in expectations that started the week of the November election.
The potential impact that President-elect Donald Trump could have on the economy is encouraging some individual investors and creating uncertainty or concern among others. Also influencing investor sentiment are valuations, earnings, consumer sentiment and the magnitude and timing of future interest rates.
This week’s special question asked AAII members what they thought will most influence the direction of stock prices in 2017. More than a third of all respondents (37%) said the policies instituted by the Trump administration and the legislation passed by the Republican-controlled Congress. Tax reform was listed by 18% of respondents, while deregulation and federal spending were each cited by 5% of respondents. Beyond the political arena, slightly more than 9% of respondents said earnings will influence stock prices, 8% said monetary policy and 6% said consumer sentiment. Some respondents gave more than one factor in their answers.
Here is a sampling of the responses:
- “Actual government changes by the Trump administration versus the high expectations for him.”
- “President Trump’s economic plans and actions.”
- “The extent of deregulation and changes in trade policy.”
- “Federal Reserve actions and passed tax legislation.”
- “Earnings growth.”

Bullish: 46.2%, up 0.6 points
Neutral: 28.6%, down 0.1 points
Bearish: 25.2%, down 0.5 points
Bullish: 38.5%
Neutral: 31.0%
Bearish: 30.5%
December 29, 2016 17 Investing Resolutions for 2017
December 22, 2016 Dow 20,000 Shows How Bad We Are at Analyzing Numbers
December 15, 2016 Those 2017 Fed Forecasts May Prove to Be Wrong
December 9, 2016 Not Clear That Mutual Funds Are Becoming More Tax-Friendly

Discussion
No comments have been added yet. Add your thoughts to the discussion!
You need to log in as a registered AAII user before commenting.
Create an account