

Suggestions for Conducting a Quick Analysis of a Stock
by Charles Rotblut | July 20, 2017
A special note to those you who are investment professionals: We have room for just five more exhibitors at our forthcoming Investor Conference. The conference will be held from November 3-5 at the Loews Pacific Resort in Orlando. Click here for more information. (Individual investors, as well as industry professionals, who are simply interested in attending the conference can click here to register. Don’t delay, as the conference is already 70% sold out.)
Let’s say you want to do a quick analysis of a stock. Perhaps you’re just looking to give the tires a good kick. Alternatively, you rely on charts and want to make sure the fundamentals are in your favor… or at least not against you. What should you look at?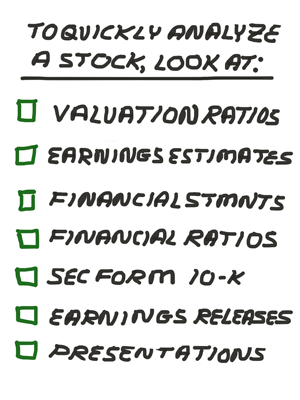
The following will give an overview of some of the key things I look at. The suggestions are not meant to be a comprehensive guide to everything you should consider. They may also leave you exposed to risks that further research would have identified. They will cover a lot of ground, however, and are certainly better than not conducting any of your own research.
Valuation Ratios: You simply don’t want to overpay for a stock. Lower valuation ratios (price-earnings, price-to-book, price-to-sales, price-to-cash flow, etc.) are better than higher ones. Very high price-earnings and price-to-book ratios can also signal low levels of earnings or book value, respectively.
Earnings Estimates: Look to see if analysts are raising their forecasts (good) or cutting them (bad). Also, check to see if the company is beating forecasts or missing them. Finally, check growth. Are earnings projected to rise or fall?
Financial Statements: There is no substitute for looking at the financial statements. Not just for the current year, but for past years. Five to seven years will give you a good idea of the growth trends in sales, profits, cash flows and dividends. Start with the income statement and then go to the cash flow statement. Look to see if cash from operations is consistently positive (it’s a negative sign if it isn’t) and whether it’s greater than income after taxes (if cash flow is smaller, the company might be aggressive with its accounting practices). Scroll down to, or calculate, free cash flow (cash from operations less capital expenditures). Free cash flow should be positive for most years. Finally, glance at cash from financing. Positive numbers for cash from financing indicate that the company has raised cash either through debt or by selling stock. Jump over to the balance sheet and compare shareholder equity to total liabilities; disproportionately high liabilities imply the company is laden with debt.
Financial Ratios: Gross and operating margins will quickly tell you if the company is becoming more or less profitable. Rising asset turnover ratios are a sign of improving efficiency. Companies using share buybacks to reduce the net number of shares outstanding will have positive buyback yields. The payout ratio will reveal if the dividend is sustainable. Stock Investor Pro subscribers can also see the Piotroski F-Score; scores of six or higher are preferable.
10-K: The 10-K is an annual filing required by the Securities and Exchange Commission. You can locate it, and other regulatory filings, on EDGAR. Scan through it to understand what the company does and what its potential risks are. If something seems suspicious or otherwise not right, trust your gut and find a different stock to invest in.
Earnings Releases: I find it helpful to look at the 10-K first or in conjunction with the earnings statement. This is particularly the case if the company’s executives are using internal or industry lingo. Determine how the company has performed, the reasons for the performance and what the executives expect to happen in the foreseeable future. You’ll find the earnings releases on a company’s investor relations website. You may also find it useful to read the conference call transcript, which can be found on Seeking Alpha (call up the quote page for the stock and then click on “earnings”).
Presentations: Many companies publish slides from their presentations on their investor relations websites [thank the SEC’s Regulation Fair Disclosure ("Reg FD") for this.] The slides can provide a good overview of the business and what trends management is seeing.
If this seems like a lot, it’s not. You can do all of this analysis in about 10 to 15 minutes. The analysis won’t identify all risks, but it will give you a good sense of whether or not a stock is attractive. It’s certainly much better than not doing any research or relying on someone else’s opinion. I will add that if you have a few extra minutes and have access to brokerage research, call up the reports to see if there is something important you overlooked.

-
Using a Simple Worksheet to Analyze a Stock – This Investor Classroom lesson discusses a downloadable spreadsheet designed to help you assess whether or not a stock is a good bargain.
-
16 Financial Ratios for Analyzing a Company’s Strengths and Weaknesses – These ratios allow you to quickly compare the fiscal strength, profitability and efficiency of two or more companies.
Pessimism among individual investors about the short-term direction of the stock market fell to its second-lowest level of the year as optimism rebounded to a 11-week high. The latest AAII Sentiment Survey also shows neutral sentiment falling below 40% for the first time in four weeks.
Bullish sentiment, expectations that stock prices will rise over the next six months, jumped 7.2 percentage points to 35.5%. Optimism was last higher on May 3, 2017 (38.1%). Even with this week’s large increase, bullish sentiment remains below its historical average of 38.5% for the 21st consecutive week and the 26th time out of the last 27 weeks.
Neutral sentiment, expectations that stock prices will stay essentially unchanged over the next six months, fell 3.4 percentage points. Nonetheless, neutral sentiment remains above its historical average of 31.0% for the 12th consecutive week and the 17th out of the last 18 weeks.
Bearish sentiment, expectations that stock prices will fall over the next six months, fell 3.8 percentage points to 25.8%. Pessimism was last lower on January 4, 2017 (25.2%). The drop keeps pessimism below its historical average of 30.5% for the 10th time out of the last 12 weeks.
This year’s trend of below-average levels of optimism continues. Since the start of 2017, bullish sentiment has only matched or exceeded its historical average three times (January 4, January 11 and February 22.) The rebound in optimism that took place this week occurred as both large-cap and small-cap indexes rose to new record highs. The rebound also followed what had nearly been an unusually low reading in bullish sentiment last week.
While some individual investors are encouraged by this year’s record highs for the major indexes, others fret about the prevailing level of valuations. The Trump administration’s ability (or lack thereof) to move forward on economic and tax policy remains at the forefront of many investors’ minds and is having a significant impact on sentiment. Other factors playing roles are earnings, concerns about the possibility of a pullback in stock prices and interest rates/monetary policy.
Historical averages:
- Bullish: 38.5%
- Neutral: 31.0%
- Bearish: 30.5%

Bullish: 35.5%, up 7.2 points
Neutral: 38.7%, down 3.4 points
Bearish: 25.8%, down 3.8 points
Bullish: 38.5%
Neutral: 31.0%
Bearish: 30.5%
July 13, 2017 Value Works, But You May Want to Add Additional Criteria
July 6, 2017 Two Concepts That Can Affect Your Returns
June 29, 2017 Implications of the Declining Number of Stocks
June 22, 2017 Don’t Like Volatility? Take a Longer-Term View

Discussion
No comments have been added yet. Add your thoughts to the discussion!
You need to log in as a registered AAII user before commenting.
Create an account