

The Stretch of Low Optimism Continues
by Charles Rotblut | January 03, 2019
Last month, optimism and pessimism in our weekly Sentiment Survey reached unusual levels. Bullish sentiment plunged to 20.9% on December 12, 2018, while bearish sentiment jumped to a multi-year high of 50.3% by the end of December. Of the two, unusually low readings for optimism have a stronger record of being a contrarian indicator.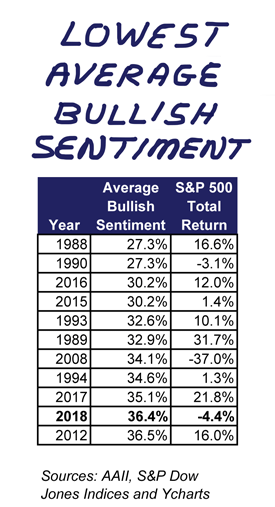
The table displayed below on the web version of this commentary shows the historical performance of the S&P 500 index following the unusual readings for our sentiment measures: bullish, neutral and bearish. As I was updating it, I revisited the annual rankings of average bullish sentiment. Specifically, I looked to see how 2018’s average level of optimism compares to past years.
Last year, bullish sentiment averaged 36.4%. This ranks 2018 as having the 10th lowest level of optimism over the survey’s 31.5-year history. (The survey started in July 1987.) What’s more interesting is the recent trend: 2015, 2016, 2017 and 2018 all rank in the bottom 10 when it comes to average levels of bullish sentiment. Put another way, if we were to split the annual averages into thirds, the last four years would all be placed in the bottom tier in terms of how optimistic AAII members were about the short-term direction of the stock market.
This comparatively lower level of optimism has occurred during a mixed stretch in terms of returns. Double-digit gains were realized in 2016 (12.0% total return for the S&P 500) and in 2017 (21.8%). Dividends kept the total return in positive territory during 2015 (a 1.4% total return). Last year was a tough one, with a loss of 4.4%. Combined, the four-year span realized an annualized return of 7.2%. A below-average gain, but certainly not horrible.
The below-average levels of sentiment fit in with the narrative of the post-financial-crash bull market being unloved. They also highlight the difference between expectations and performance. Five of the 10 years with the lowest average level of bullish sentiment saw double-digit gains for large-cap stocks (1988, 1989, 1993, 2016 and 2017). The S&P 500 was barely positive in 1994 and 2015. It incurred losses in 1990, 2008 and 2018.
We’ve long seen a disconnect between sentiment and allocations. Many AAII members have told us over the years that they follow long-term strategies. While some of you do take tactical steps or otherwise adjust your allocations based on market conditions, it has been our observation that this is not universally the case. There is a difference between expecting tougher market conditions and acting on those feelings.
Many refer to Warren Buffett’s advice of being “fearful when others are greedy and greedy when others are fearful.” Our survey lends support to this guidance. Opportunities to buy stocks arise when many others don’t expect them to do well. While the link between unusual levels of bullish sentiment and market performance is not causal, it can be a useful sign to stop and look at the broader market mosaic. Question whether valuations are high or have been discounted. Check your allocation to see if it is still approximately in line with your goals. Consider whether the talking heads, as a group, are sounding overly optimistic or pessimistic. You may find an opportunity to go bargain-shopping or to anticipate below-median returns for the next six to 12 months.
Table 1. Performance of the AAII Sentiment Survey Without Hindsight
| Bullish | Neutral | Bearish | Bull 8-wk | Bear 8-Wk | B/B Spread | S&P 500 | |
| +1 Standard Deviation above Average, 26-week Returns | |||||||
| Average | 2.7% | 4.9% | 4.4% | 2.6% | 4.9% | 3.4% | 4.5% |
| Median | 3.7% | 5.3% | 5.7% | 3.0% | 6.7% | 3.9% | 5.2% |
| Periods with Gains | 220 | 103 | 198 | 224 | 245 | 192 | 1196 |
| Periods with Losses | 81 | 32 | 100 | 95 | 116 | 66 | 411 |
| Total Count | 301 | 135 | 298 | 319 | 361 | 258 | 1607 |
| Percent Contrarian | 26.9% | 76.3% | 66.4% | 29.8% | 67.9% | 25.6% | |
| Contrarian Movement | Losses | Gains | Gains | Losses | Gains | Losses | |
| -1 Standard Deviation below Average, 26-week Returns | |||||||
| Average | 7.4% | 2.1% | 3.8% | 7.2% | 4.0% | 5.5% | 4.5% |
| Median | 6.9% | 3.1% | 4.2% | 6.6% | 4.5% | 6.5% | 5.2% |
| Periods with Gains | 147 | 240 | 128 | 147 | 130 | 180 | 1196 |
| Periods with Losses | 34 | 145 | 48 | 34 | 50 | 67 | 411 |
| Total Count | 181 | 385 | 176 | 181 | 180 | 247 | 1607 |
| Percent Contrarian | 81.2% | 37.7% | 27.3% | 81.2% | 27.8% | 72.9% | |
| Contrarian Movement | Gains | Losses | Losses | Gains | Losses | Gains | |
| +1 Standard Deviation above Average, 52-week Returns | |||||||
| Average | 5.6% | 11.9% | 7.6% | 5.7% | 8.5% | 6.8% | 9.3% |
| Median | 7.7% | 12.5% | 12.2% | 7.7% | 12.5% | 8.4% | 11.2% |
| Periods with Gains | 217 | 107 | 211 | 233 | 261 | 193 | 1264 |
| Periods with Losses | 81 | 23 | 85 | 80 | 100 | 62 | 317 |
| Total Count | 298 | 130 | 296 | 313 | 361 | 255 | 1581 |
| Percent Contrarian | 27.2% | 82.3% | 71.3% | 25.6% | 72.3% | 24.3% | |
| Contrarian Movement | Losses | Gains | Gains | Losses | Gains | Losses | |
| -1 Standard Deviation below Average, 52-week Returns | |||||||
| Average | 13.3% | 2.9% | 7.4% | 13.5% | 10.6% | 9.4% | 9.3% |
| Median | 16.0% | 7.1% | 8.9% | 15.3% | 11.9% | 15.3% | 11.2% |
| Periods with Gains | 152 | 243 | 130 | 163 | 145 | 189 | 1264 |
| Periods with Losses | 27 | 142 | 44 | 18 | 35 | 56 | 317 |
| Total Count | 179 | 385 | 174 | 181 | 180 | 245 | 1581 |
| Percent Contrarian | 84.9% | 36.9% | 25.3% | 90.1% | 19.4% | 77.1% | |
| Contrarian Movement | Gains | Losses | Losses | Gains | Losses | Gains | |
| Source: AAII Sentiment Survey; Data from June 24, 1987 through December 26, 2018 | |||||||

-
Analyzing the AAII Sentiment Survey Without Hindsight – I discussed how we determine what an unusually high or low reading is, and our rationale for doing so, in this 2014 AAII Journal article. The data is older, but the explanations remain valid.
-
Investment Sentiment Indicators: Quite Contrary? – In this 2004 article, Mark Hulbert discussed the history of sentiment indicators and made observations on their usefulness.
Pessimism among individual investors about the short-term direction of the stock market is above 40% for the fourth consecutive week and the fifth time in seven weeks. The latest AAII Sentiment Survey also shows rebounds in optimism and neutral sentiment.
Bullish sentiment, expectations that stock prices will rise over the next six months, rose 1.5 percentage points to 33.0%. Optimism remains below its historical average of 38.5% for the 15th time in 17 weeks.
Neutral sentiment, expectations that stock prices will stay essentially unchanged over the next six months, rebounded by 6.1 percentage points to 24.2%. Even with the increase, neutral sentiment is below its historical average of 31.0% for the ninth time in 10 weeks.
Bearish sentiment, expectations that stock prices will fall over the next six months, fell 7.5 percentage points to 42.8%. This is the 13th consecutive week and the 16th time out of the last 17 weeks that pessimism above its historical average of 30.5%.
The last time bearish sentiment stayed at or above 40% for at least four consecutive weeks was the five-week stretch of September 8 through October 6, 2011. This week’s reading keeps pessimism at an unusually high level (above 39.8%). Historically, unusually high bearish sentiment readings have been followed by above-median six- and 12-month returns for the S&P 500 index.
Both bullish and neutral sentiment are back within their typical ranges.
Market volatility and worse-than-anticipated returns are influencing individual investors’ outlook for the stock market. Also having an influence are Washington politics (including President Trump and the change in House leadership), tariffs (particularly the ongoing trade war with China), corporate earnings, the Federal Reserve, valuations and concerns about the pace of economic growth.
The survey period runs from Thursday through Wednesday.

Bullish: 33.0%, up 1.5 points
Neutral: 24.2%, up 6.1 points
Bearish: 42.8%, down 7.5 points
Bullish: 38.5%
Neutral: 31.0%
Bearish: 30.5%
December 27, 2018 21 Investing Resolutions for 2019
December 20, 2018 One or Two Rate Hikes in 2019?
December 13, 2018 An Updated Look at the Yield Curve and Stock Market Volatility
December 6, 2018 The Taxes You May Be Paying on Your Investments

Discussion
No comments have been added yet. Add your thoughts to the discussion!
You need to log in as a registered AAII user before commenting.
Create an account