

Related

Portfolio Strategies
O’Shaughnessy helps to find strategies that have the highest “base rate” with the belief that a composite strategy can help achieve both higher and more consistent performance than single-variable strategies.
by John Bajkowski | March 2019

James P. O’Shaughnessy provides a detailed examination of investment strategies in the fourth edition of his book “What Works on Wall Street: The Classic Guide to the Best-Performing Investment Strategies of All Time” (McGraw-Hill Education, 2011, $45.00).
O’Shaughnessy argues that the majority of investors fail to beat market averages because they do not follow a disciplined approach to investing. Instead, investors let the emotions surrounding the market overpower their judgment and push them off their planned investment course. Investors tend to chase investments with the best recent performance, while ignoring anything that happened more than three to five years ago. Furthermore, O’Shaughnessy makes the case that the markets are not random. The stock market does not move around without any rhyme or reason; it “rewards certain investment strategies while punishing others.”
In the fourth edition of “What Works on Wall Street,” O’Shaughnessy examines a wide range of strategies over 80-plus years of testing to identify which individual factors delivered the best risk-adjusted performance with the greatest consistency. Most strategies are mediocre, and the majority fail to outperform the S&P 500 index. As first discussed in the October 2013 AAII Journal, O’Shaughnessy found that there is no best single factor strategy. While price-to-sales (P/S) and EBITDA-to-enterprise-value ratios compete for best-performing strategy, the time period under study strongly impacts relative performance. Investors can achieve better long-term performance by combining several factors into a composite ranking that considers price to sales, price to earnings (P/E), EBITDA to enterprise value, free cash flow to enterprise value and shareholder yield. Additional gains come from also considering the financial strength of companies and their earnings quality.
O’Shaughnessy and his son Patrick were kind enough to examine the data universe of Stock Investor Pro (AAII’s stock screening and analysis software) and come up with stock screening criteria that best match the spirit of the value composite, financial strength composite and earning quality measure screens that proved to be successful. This screen was first published in the March 2014 AAII Journal. Our First Cut revisits the screen.
The First Cut looks for stocks with a market capitalization (shares outstanding times market price) of $200 million or greater. We then also require that stocks be listed on the New York, American or Nasdaq exchange. We exclude closed-end funds, exchange-traded funds (ETFs) and real-estate investment trusts (REITs). Finally, we exclude foreign-listed stocks trading as American depositary receipts (ADRs). This left us with around 3,000 companies to analyze.
O’Shaughnessy tested a number of basic value strategies that seek to identify out-of-favor investments that are priced attractively in relationship to measures such as the price-to-sales ratio. Our value composite consists of the price-to-free-cash-flow ratio, price-earnings ratio, price-to-sales ratio, enterprise-value-to-EBITDA ratio and shareholder yield. We calculate an average of the percentage rank of these value factors, requiring at least three of the factors to have a value to be included in the value composite. The First Cut requires that companies have a value composite among the lowest 10% of companies.
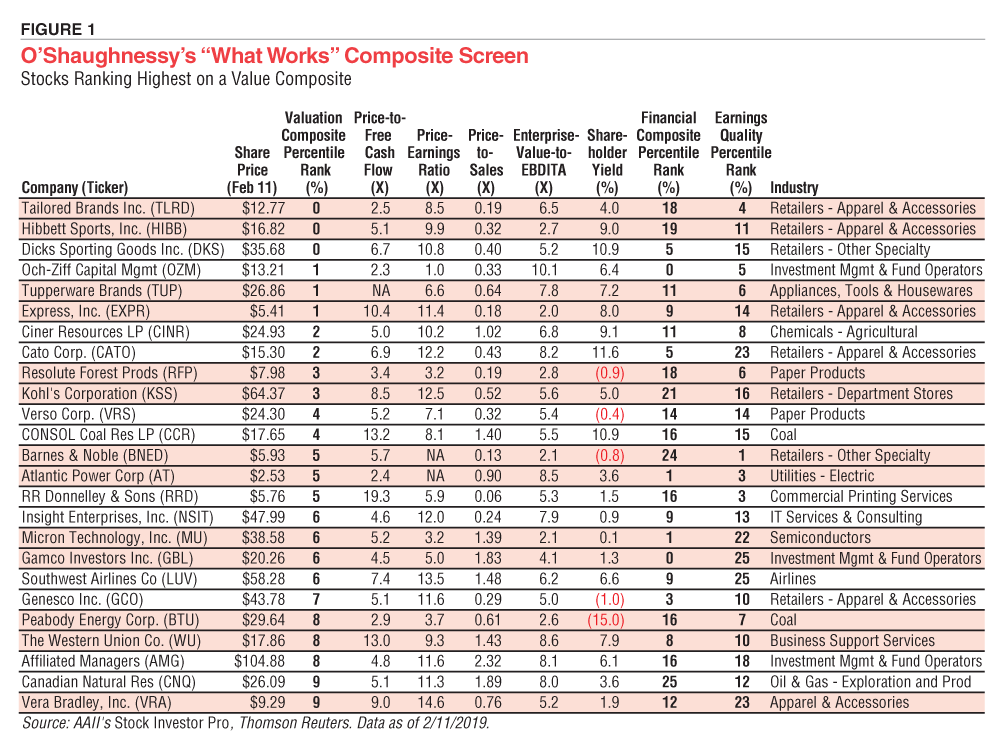
The financial strength composite ranks stocks on the following four factors: debt-to-equity ratio, times interest earned, external financing and one-year change in debt. The composite is created exactly like the value composite, with stocks with the best levels for each factor receiving a 1 and stocks with the worst levels for each receiving a 100. In the case of the financial strength composite, a stock must have a value for at least two of the four factors. The First Cut requires that companies have financial strength among the best 25% of our all-stock universe. The table lists the financial composite rank.
O’Shaughnessy also looked at the earnings quality. He created a composite that consisted of the ratio of current accruals to assets, change in operating assets, ratio of total accruals to total assets and ratio of depreciation to capital expenditures. The composite score was ranked so that companies with lower percentage rankings were more desirable. The First Cut requires that stocks be in the lowest 25% of earnings quality rank. The table lists percentile rank of the earnings quality composite.
Twenty-five companies pass the First Cut, and they are ranked in the table by their valuation composite percentile rank.
“What Works on Wall Street” is a rich resource for the investor wishing to study the markets and develop a long-term investment strategy. It is important to understand that all strategies have good and poor performance cycles. O’Shaughnessy helps to find strategies that have the highest “base rate” with the belief that a composite strategy can help achieve both higher and more consistent performance than single-variable strategies. One can also use accounting variables to measure financial strength and earnings quality to improve investment performance. O’Shaughnessy argues that the market is far from random and that a sound, disciplined, emotion-free investment approach is the only way to beat the market over the long term.
The “What Works” composite screen relies on the ranking of composite scores that must be done in a spreadsheet. You can download the spreadsheet used to create the list of companies here: www.aaii.com/files/excel/What-Works.xlsx
Portfolio Strategies

Stock Strategies

Houyhnhnm from NM posted over 7 years ago:
You need to log in as a registered AAII user before commenting.
Log InCreate an account