


In January 1987, we witnessed an investment tragedy in the making. As the Dow Jones industrial average crossed the 2,000-mark, people all over the country—including many elderly—filed into their banks to cash out their certificates of deposit for funds to pour into the stock market.
These investors rode the market to a peak in August, making profits of up to 35% and more in only eight months. But for those still invested in October, it all came crashing down. Many saw their gains evaporate and the value of their principal plummet.
At this point, investors could still have recouped their losses and made a respectable 20% annual return to date if they had simply held the stocks they bought so frantically earlier. But many compounded their bad timing by selling after the crash at a loss and putting the money into fixed-income investments, for a return of a mere 9% a year.
The Long-Term Approach
The lesson here is not that investors should all become good market timers—quite the opposite. It is next to impossible to time the market accurately and consistently. Few professional money managers try to outguess the market on a short-term basis; neither should individual investors.
Instead, wealth in the stock market should be accumulated slowly, using a long-term outlook and strategy.
History confirms this rational approach to investing. During the last 64 years—through depression, wars, assassinations, recessions and scandals in which the stock market has dropped substantially in individual years—stocks, based on the S&P 500 index, have averaged a gain of slightly more than 10% per year.
The Costs of Panic-Selling
In the short term, history also sides with those who resist panic-selling after a precipitous market downturn. Let’s look at what would have happened from 1930 through 1974 if investors had made the classic mistake of selling their stocks and rushing to “safe” Treasury bills each year the S&P 500 was down 10% or more.
The results are depicted in Table 1. The table displays the initial drop in the S&P 500, and then indicates what occurred over the longer time frames of three and five years later. The S&P 500 returns three and five years later include the initial decline. For instance, in 1930, the S&P 500 dropped 24.9%; after three years, however, the S&P 500 was down only 11.9%, indicating that it recovered lost ground in the years following the decline. The table also indicates the value of a $100 investment if it remained invested in the S&P 500, and if it were withdrawn from the market after the decline and reinvested in Treasury bills.
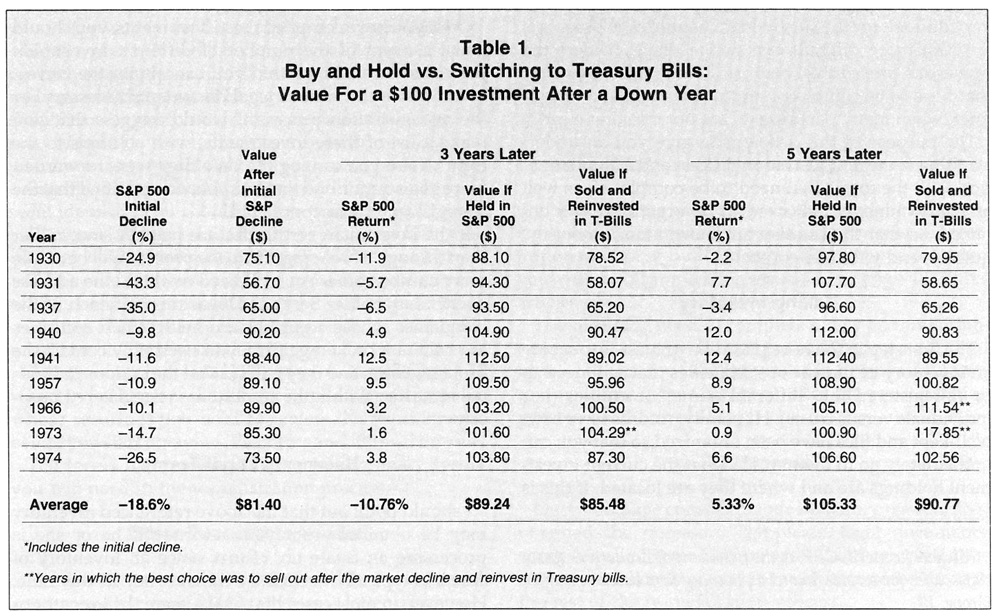
For all nine of the “down” years except 1973, it was better to hold on to the S&P stocks for the three years following the downturn than to sell out and invest in Treasury bills. Only two of the down years, 1966 and 1973, were followed by a five-year aftermath that produced better results for the Treasury bill buyers.
Even at the end of 1931, when the market went down 43.3%, an investor would have been far ahead if they had remained in stocks. The market rebounded so much that an investment of $100 at the beginning of 1931 would have risen to $107.70 by the end of 1936—not an astounding return, but the person who sold those stocks after the 1931 beating and invested in Treasury bills would have emerged with only $58.65 for the same period.
Extrapolating From Short-Term Trends
Using the last 64 years as a guide, one can predict the Dow will go to nearly 7,200 in the next decade. The last 64 years are a good sample because they have seen just about every kind of negative force the stock market could have.
As staggering as that 7,200 figure seems today, however, some prognosticators are looking at a Dow of 13,000 by the turn of the century. They are taking results only from the last five years of the market, which produced a return of 20% in the S&P. It’s the tendency to take any two dots and connect them and call them a trendline, instead of looking at the big picture over the long term.
To illustrate the pitfalls in short-term trendlines, we could predict the growth in numbers of Elvis Presley impersonators by extrapolating from previous increases. In 1960, there were 216 Elvis impersonators in the U.S. by unofficial count. In 1970, there were an estimated 2,400; and by 1980, the number had grown to an estimated 6,300. Assuming the continuation of this trend, the number will hit 14,000 this year, and by the year 2010 one in four people in the U.S. will be an Elvis impersonator!
Do we think we’ll ever really be inundated by that many Elvis impersonators? Of course not. Yet, investors commit the same error when they see the market going up and decide to buy, thinking it will keep going up at the same rate. Or when they see the market down 25% and sell in panic merely on the assumption that the downward slide will continue.
History rarely repeats itself back to back. But the securities industry landscape is littered with investor mistakes resulting from the assumption that whatever happens will keeping repeating itself. In 1974, for example, after the gold market rose dramatically from the low-double digits to the $300 range, a number of precious metals mutual funds appeared. As it turned out, they came out at the peak of the market, and very few have ever equaled the price at which they were offered.
It is best to resist rushing toward the hot trend of the moment.
Instead of waiting for confirmation of a market trend and then overreacting, investors would do well to plot a course using the investment style they are comfortable with based on their own risk tolerances and circumstances.
Then, as each milestone is reached, an orderly, businesslike transition to the next phase, without regard for the inevitable market blips, will maximize results over the long term.
This article was written by John A. Vann for the March 1991 issue of the AAII Journal. At the time, he was a senior vice president at Dean Witter Reynolds and a senior consultant in the firm’s Dallas-based Investment Consulting Services.
Discussion
FREE REPORT

No comments have been added yet. Add your thoughts to the discussion!
You need to log in as a registered AAII user before commenting.
Log InCreate an account