


Risk is an important element of any investment decision. Yet it is an elusive concept, and difficult to measure.
For example, suppose you can choose between two investments. One offers $1 outright, the other offers $1 per spot on the roll of the die. Which investment is riskier?
According to traditional risk measures, which examine variability, the roll of the die is riskier—your return could vary anywhere from $1 for one spot to $6 for six spots. At the same time, you would probably not think of it as riskier, because it has no chance of underperforming the sure thing. In other words, the worst you could possibly do with the roll of the die is to receive $1—the same return that you would receive with the sure thing—and the probability is large that you will receive more than $1.
Risk is a multidimensional concept. Risk is also a fundamental concept and, therefore, it is important for investors to understand all the aspects of risk. This article focuses on risk, and it extends the concept beyond the familiar risk of absolute dollar return, as measured by volatility, to include the risk of relative dollar return.
Relative vs. Absolute Risk
What’s the distinction between absolute and relative dollar returns? If uncertainty is defined in absolute dollar returns, the first investment—the $1 outright—is certain, since the return will always be $1. However, if uncertainty is defined in relative terms, the roll of the die presents the certain alternative, because it is certain that the outcome will always be equal to or greater than the first investment.
Suppose we change the investment alternatives to a sure $3 versus $1 per spot on the roll of a pair of dice. The roll of the dice produces a less certain absolute dollar return than the sure thing, ranging from $2 for snake eyes (a pair of singles), to $12 for box cars (a pair of sixes). But many investors would hesitate to call it riskier, because there is only about a 3% chance that the roll would produce a pair of spots, generating a $2 return, and thus underperform the sure $3 return.
This concept also exists in the investment world. Is a portfolio that contains an equal amount of stocks and long-term bonds riskier than a portfolio that simply contains Treasury bills, which are commonly thought of as “riskless” investments?
The answer depends upon the length of the individual’s investment horizon. The stock market is very variable, but over the long term the returns have been positive and much higher than those of Treasury bills. If the individual investor’s investment horizon is sufficiently long, the relative riskiness of a balanced portfolio of stocks and debt is akin to that present in the dice example. The absolute dollar return on the balanced portfolio is less certain than the absolute dollar return on the Treasury bill portfolio. But it would be difficult to call the balanced portfolio riskier, because it is almost certain over a long-term period to provide a return that is higher than the Treasury bill portfolio.
These examples illustrate four major points:
- First, the risk of a portfolio depends upon the length of the planned investment horizon.
- Second, there are substantial benefits to diversification across time periods.
- Third, traditional risk measures can be misleading, especially when comparing the riskiness of longer-term investments.
- Finally, the probability of underperforming some target return or target value is a measure of relative risk. This downside measure complements the traditional risk measures because it helps distinguish between uncertainty of dollar return and risk. The downside measure also better illustrates the impact of the length of the investment horizon on the choice of investments.
Measuring Relative Risk: An Illustration
This concept can be illustrated by looking at simulations of returns based on the historical performance (1926 through 1984) of portfolios that include a variety of securities, such as Treasury bills and bonds, corporate bonds, common stocks and combinations of these securities.
Table 1 provides simulations over one year and over 30 years. It indicates for the various portfolios the expected amount to which $1 would grow that is in excess of the amount that would be made by investing in Treasury bills. Excess returns are used because investors are primarily concerned with the purchasing power of an investment, and excess returns closely resemble the real returns for longer-term investment periods. Historically, Treasury bill returns have been about equal to inflation.
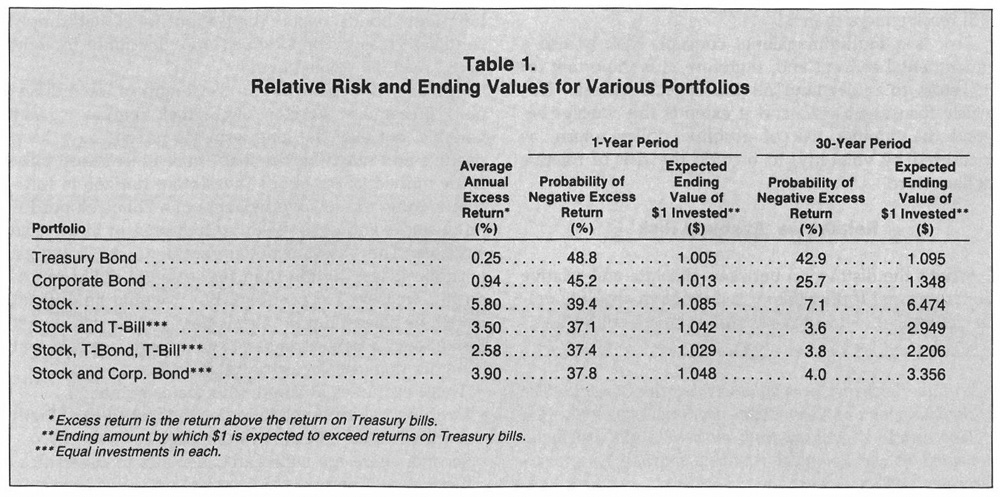
Table 1 also provides a measure of relative risk. Relative risk, as we have noted, can be thought of as the probability of not achieving some target level of return. The return on Treasury bills would represent such a target level for many investors, because it is representative of returns available from money market funds. The table presents, for both one-year and 30-year periods, the estimated probability of realizing a return less than Treasury bills.
Comparing the probabilities of the two time periods in Table 1 highlights an important risk-reduction feature of the concept of time diversification: The probability that an investor would receive a return that was less than that of Treasury bills decreases markedly as the investment horizon increases. Thus, the relative riskiness of an investment depends on the length of the investment horizon. For example, the diversified portfolios—those containing a combination of stocks and fixed-income securities—have only a 4% chance of being outperformed by a portfolio of Treasury bills when the investment horizon is 30 years. Put more positively, the diversified portfolios have a 96% chance of outperforming a Treasury bill portfolio (a positive excess return) over the longer time period. That compares with only a 63% chance of outperforming a Treasury bill portfolio over a one-year period.
These results indicate that for a long-term investment period, it is virtually certain that the diversified portfolio will outperform the bills-only portfolio. Yet variability measures would indicate that the diversified portfolios are substantially riskier.
This is illustrated in Figures 1 through 6, which graphically depict the results of the simulations over the 30-year period; for comparison purposes, all of these graphs are on the same scale. For the various portfolios, the figures indicate the range of ending values that are possible, based on the variability of returns. The middle line indicates the most likely outcome (the last column in Table 1), while the outer lines represent the range of possible ending values. The horizontal dotted line indicates a zero excess return (an expected ending value of $1), which would be the return that would occur with a Treasury bill portfolio. It is important to note that the figures only represent ending values for $1 invested continuously over 30 years and are not indicative of an investment over shorter time periods.
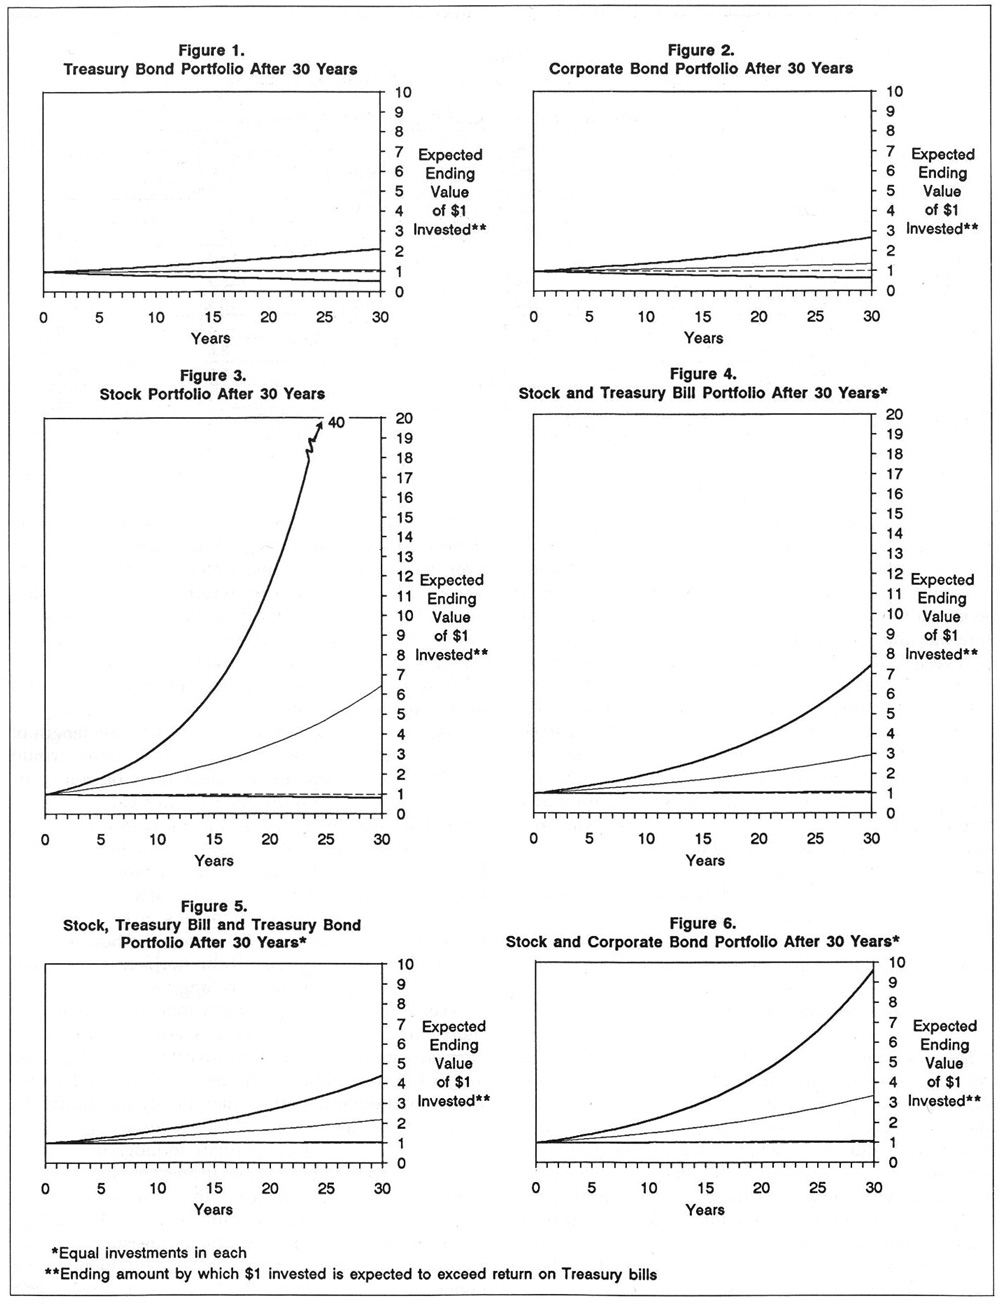
The ranges are wide for the stock and diversified portfolios. Yet their lowest ranges—the worst outcomes—parallel and are no worse than a Treasury bill portfolio. In contrast, the ranges for the bond portfolios are much less, yet they are most likely to produce returns barely above the Treasury bill rate, and in the worst instances they could produce returns that would be below the Treasury bill rate.
The absolute returns on the diversified portfolios are clearly less certain than a Treasury bill portfolio, but it is difficult to call these portfolios riskier, since they are almost certain to outperform Treasury bills.
Investment Implications
These examples illustrate the problem of using “variability” of absolute dollar return as a risk measure when comparing investment alternatives over time. Many individual investors are long-term oriented and must face this difficulty when making their decisions. For instance, the Treasury bill versus a diversified portfolio example illustrates the choices for an IRA investor who is considering a money market fund or a balanced mutual fund. Since variability is not a sufficient risk measure, investors with a longer-term horizon should look at relative risk.
Table 2 presents estimated probabilities of realizing returns below those of a pure Treasury bill portfolio over various time horizons, a measure of relative risk. The probability of realizing returns below a Treasury bill portfolio decreases for a given portfolio as the investment horizon is lengthened. The most dramatic decreases are realized in the diversified portfolios.
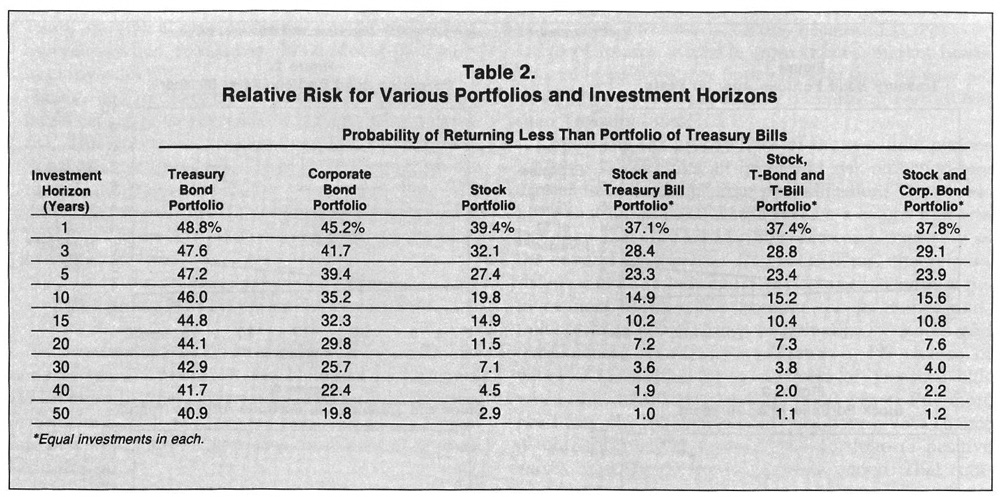
These results clearly illustrate a number of important investment implications.
First, the risk of a portfolio depends on the length of the investment horizon. Although all investors would consider the mixed portfolios riskier than Treasury bills for short investment horizons, the same cannot be said for long investment horizons. Many investors are aware of the concept of portfolio risk—an investment may be very risky if held alone but may have lower risk if held in a diversified portfolio. Similarly, a portfolio’s risk, or even an individual asset’s risk, should be judged based on the planned investment horizon. The portfolio may be very risky if the horizon is short, but of modest risk if the horizon is long.
Second, the percentage of a portfolio invested in non-short-term debt should, everything else being the same, increase with the length of the investment horizon. The longer the time horizon, the more that should be invested in alternatives other than money market funds, since they will lower an investor’s relative risk.
Finally, it is often inappropriate to judge the success of a portfolio of longer-term securities by its return over shorter time periods. Instead, the portfolio’s success should be measured by its return over the planned investment horizon. The downside measure complements the traditional risk measures by highlighting important elements of the elusive concept of risk.
This article was adapted from an article that originally appeared in the Financial Analysts Journal, November-December 1986.
Discussion
FREE REPORT

No comments have been added yet. Add your thoughts to the discussion!
You need to log in as a registered AAII user before commenting.
Log InCreate an account