


What do you do when you want to invest a sizable amount of cash in the stock market?
The cash may have come from a lump-sum retirement distribution, court settlement or inheritance, but the question investors face is the same: Should the funds be immediately invested in a diversified stock portfolio all at once or should the money be gradually invested in the market over time?
The conventional wisdom, at least among professional investment advisers, is that the lump sum should be gradually moved into stocks in order to reduce the risk that you are investing the entire amount at a market high. Such advice really amounts to a form of dollar cost averaging, a strategy long recommended by investment textbooks.
This article fills a void in the literature by reporting the results of an empirical study that compares the efficacy of a dollar-cost-averaging strategy with that of lump-sum investing over a long-term historical time period. The averaging strategy examined here differs from the kind usually discussed in investment texts in that we assume a lump sum initially invested in Treasury bills and gradually shifted into the stock market in periodic equal dollar amounts. The more common assumption is that the investor accumulates wealth by diverting a constant amount each period from current income into the market.
The Study
The study is based on monthly total rates of return for the S&P 500 index and 90-day Treasury bills over the period 1926 through 1991 as reported in Ibbotson Associates’ “Stocks, Bonds, Bills & Inflation 1992 Yearbook.” The lump-sum strategy assumed that the entire amount was invested in the stock market at the beginning of a 12-month holding period. For the dollar-cost-averaging strategy, we assumed that the total amount was initially invested in 90-day Treasury bills and then shifted in equal monthly installments into our proxy for the stock market, the S&P 500. Returns were then calculated and compared for each strategy at the end of 12-month holding periods. Taxes and transaction costs were ignored.
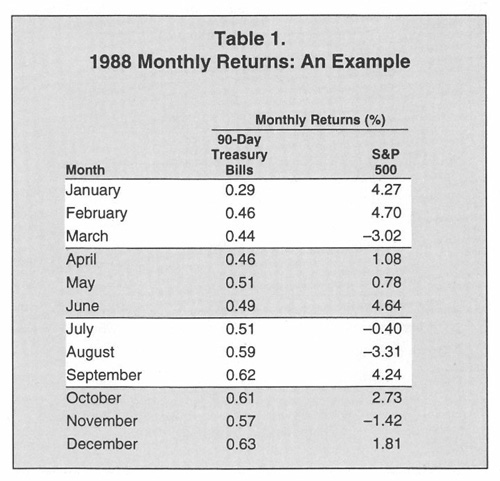
The computational procedure can be illustrated with an example that assumes an original lump sum of $120,000 and monthly return data for January through December 1988, as set forth in Table 1. Under the lump-sum strategy, the entire $120,000 would be invested on January 1 in the S&P 500. After monthly compounding, the $120,000 would have a value of $140,172 at the end of December 1988. The annualized holding-period return would be:
$140,172
———— – 1 = 16.81%
$120,000
For a 12-period dollar-cost-averaging strategy, we assumed that one-twelfth of the $120,000 would be invested in the market index on January 1, 1988, and the balance of $110,000 invested in T-bills. On February 1, a second installment of $10,000 plus one month’s accumulated interest would be invested in the S&P 500 for 11 months. This process is repeated for the entire 12-month period. Thus, by December 1, the entire $120,000 is invested in the market index. By December 31, 1988, the value of the dollar-cost-averaging portfolio would be $131,616, and the annual holding-period return would be:
$131,616
———— – 1 = 9.68%
$120,000
We also investigated the effects of both a six-month and a three-month dollar cost averaging installment period. For the six-month strategy, one-sixth of the initial amount was invested for 12 full months in the S&P 500. Another one-sixth was invested in T-bills for one month and then in the market for 11 months, etc.
For the three-month strategy, one-third of the initial amount is immediately invested in the S&P 500 for 12 full months. Another third is invested in T-bills for one month and then switched to the S&P 500 for 11 months. The final installment of one-third is in T-bills for two months before being invested in the S&P 500 for 10 full months. For each of the three dollar-cost-averaging strategies, annual holding period returns were computed for every possible starting month (January 1926, February 1926, etc., through December 1991), a total of 780 12-month periods.
The Results
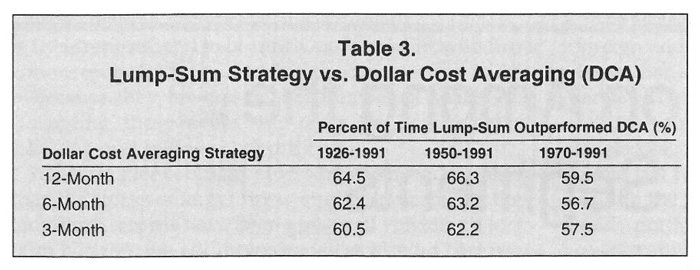
The results of the analysis are summarized in Tables 2 and 3. Three time periods are shown in each table: 1926 through 1991; 1950 through 1991 and 1970 through 1991. The first period represents the extent of the database. The second period encompasses the post-World War II era while the third covers a more recent period of investment experience and includes both the unhappy investment decade of the 1970s and the extended bull market of the 1980s.
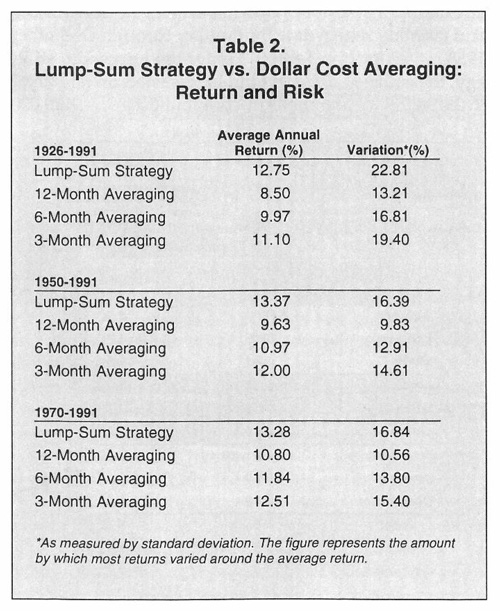
Table 2 shows the average annual returns for each strategy for each time period, as well as the risk as measured by variability (the amount by which most actual returns varied around the average). For all time periods, the lump-sum strategy produced superior returns to the dollar-cost-averaging strategies, but at higher levels of risk. Also of interest is the fact that the returns for dollar cost averaging increase as the number of dollar-cost-averaging installments is reduced. Clearly, the sooner the entire amount is fully invested in the market, the higher is the realized return.
Table 3 summarizes the number of time periods that the lump-sum strategy produced higher returns than the dollar-cost-averaging strategy. As can be seen, the lump-sum strategy outperformed dollar cost averaging nearly two-thirds of the time. The success of the lump-sum strategy dropped, however, during the 1970 through 1991 period because of the poor performance of the stock market during much of the 1970s, coupled with the high interest rates that prevailed from the mid-1970s to the early 1980s, which improved the success of a dollar-cost-averaging strategy.
What is the practical significance of the superiority of lump-sum investing over dollar cost averaging? Consider the 1950–1991 period and a $100,000 initial endowment. According to Table 2 the initial $100,000 would be worth, on the average, $100,000 × (1.1337) = $113,370 after one year of being fully invested in the market. Following a dollar-cost-averaging strategy for 12 months would result in an average compound value of $100,000 × (1.0963) = $109,630, a difference of $3,740 after one year. After 10 years, assuming an average return of 13.37%, the difference would compound to $13,118. After 20 years, the difference in wealth would be $46,008 or an amount equal to 46% of the initial amount.
Conclusions
This article has examined a common problem facing many investors, namely whether to invest a large cash amount immediately in a diversified stock portfolio or to use a dollar-cost-averaging approach to gradually shift the funds into the market. The dollar-cost-averaging approach has received wide acceptance when the assumption is that equal dollar amounts, taken from current income, are invested periodically in stocks, thus avoiding the possibility of investing all the money at a market high.
Our study looks at the problem from a different perspective. Given a lump sum, is it better to invest the entire amount immediately, or spread it out in equal installments?
Based on historical evidence, the major conclusion of our study is that an investor is better off investing the lump sum immediately, if they are willing to assume the greater risks in terms of variability of return. This conclusion emerges after calculating annualized monthly returns for three averaging strategies for all possible 12-month periods from 1926 to 1991 and comparing the results with those from investing the entire amount immediately in the market at the beginning of each period. For all time periods and averaging strategies, the lump-sum strategy produced superior returns, albeit at greater levels of risk.
These results should not be too surprising. In the great majority of time periods, diversified stock portfolios produce a higher return than Treasury bills—while stocks are riskier in terms of return variability, the market over the long term compensates investors for that risk. Thus, there is normally a relatively high opportunity cost associated with holding the uninvested portion of an amount in a risk-free asset.
Of course, the theory behind dollar cost averaging is that an investor does not know in advance what the stock market is going to do. Dollar cost averaging lowers the risk of investing the original amount at a high point and selling at a low point. The actual outcome of such a strategy, however, depends on the movement of the stock market. If the market rises, dollar cost averaging will result in a lower return than a lump-sum investment strategy, while if the market drops, it will result in a higher return.
There is, of course, no assurance that the past pattern of stock market and Treasury bill returns will persist in the future. Nonetheless, based on the historical record, investors who can overlook the risk may prefer to invest in the stock market as soon as possible.
This article originally appeared in the April 1993 issue of the Journal of Financial Planning. At the time, Richard E. Williams and Peter W. Bacon were professors in the Department of Finance at Wright State University, Dayton, Ohio.
Discussion
FREE REPORT

Andrew S. from WA posted over 7 years ago:
MJS from ID posted over 7 years ago:
CRB from CA posted over 7 years ago:
JSN from GA posted over 7 years ago:
BLK from Missouri posted over 7 years ago:
Thomas Schaber from OH posted over 7 years ago:
Hugh from WA posted over 7 years ago:
John from Ohio posted over 6 years ago:
You need to log in as a registered AAII user before commenting.
Log InCreate an account