


The current low yields offered by fixed-income securities have prompted many investors to seriously review their portfolio commitments to stocks and bonds. However, the last decade, which witnessed unusually high returns in both asset classes, offers little in the way of long-term guidance.
Longer-term historical return patterns allow investors to put the recent past into perspective. The historical data that is most frequently relied on goes back to 1926, which is the starting period for the well-known study on long-term returns by Roger Ibbotson and Rex Sinquefield (“Stocks, Bonds, Bills and Inflation”). This data provides a powerful argument in favor of equity investing as a wealth builder, particularly over longer time periods. Of course, stocks are generally riskier than fixed-income investments, and one would expect stock returns to be higher. However, data over this time period indicates that stocks produce much higher returns than bonds even after adjusting for this risk.
Do these patterns hold for longer time periods?
To answer this, I extended the time period of previous studies back to 1802 and updated the returns through 1990.
Accumulating the Data
The data used for the study came from a number of sources.
Historical stock price series have been developed that date back to 1802, which is when this study begins. In order to analyze stock returns since 1802, the data were divided into three subperiods: 1802 through 1870; 1871 through 1925; and 1926 through 1990. The first period, running from 1802 through 1870, contains stocks of financial firms and, later, railroads. The middle period consists of all stocks listed on the New York Stock Exchange. The last period coincides with the development of the S&P 500 stock index and contains the most comprehensive data on stock prices.
Long-term bonds posed somewhat of a problem. There was an active market for long-term U.S. government bonds over most of the 19th century except for the years 1835 through 1841, when prior budget surpluses eliminated all federal government debt outstanding. Despite the good data, there are persuasive reasons to use high-grade municipal bonds for part of the period. In comparing past with future bond returns, it is important to choose securities whose risk characteristics match closely, and municipal bonds are more representative of high-quality bonds during much of the 19th and early 20th centuries. Some municipal bonds issued during the early 19th century were considered of higher quality than those of the federal government, and thus traded at lower yields. In addition, risk of default on federal government bonds increased during both the War of 1812 and the Civil War, hence yields on federal debt rose above the yields on comparable high-grade municipals.
To avoid the problems with federal government bond yields, I constructed a high-grade series that uses the minimum yield on Treasury bonds and high-grade municipal bond yields from 1800 to 1865 and high-grade municipal yields from 1865 to 1917.
Treasury bills, or short-term governments, did not exist before 1920. Data on commercial paper rates dating back to the 1830s are available, but during the 19th century commercial paper was risky and variable, and thus often traded at yields that included a premium for the greater risk. To remedy this deficiency, I constructed a synthetic short-term government series that removes the risk premium on commercial paper.
Nominal Returns: 1802 Through 1990
Figure 1 illustrates the results of the study for the overall period; Table 1 includes data for the various subperiods as well as for the overall period.

Figure 1 shows what $1 invested in various asset classes in 1802 would have accumulated to by the end of 1990, assuming reinvestment of all dividends, interest and capital gains. The power of compound returns is clearly evident in the stock market. One dollar invested in 1802, with all dividends reinvested, would have accumulated to nearly $1 million in nominal terms by the end of 1990.
It is clear from the numbers that fixed-income assets fall far short of equities. With reinvestment of coupons, an initial investment of $1 in long-term bonds in 1802 would have yielded $5,770 in nominal dollars in 1990; the same investment in risk-free, short-term assets would have yielded $2,680. Both these returns are less than 1% of the sum accumulated in stocks over the entire period.
Inflation and Asset Returns
The behavior of price levels is critical to any interpretation of asset price movements over time. Consumer prices, represented by the U.S. Consumer Price Index (CPI), increased about elevenfold from 1802 to 1990, for an average compound annual rate of 1.3%. Almost all of the appreciation, however, has come in the last subperiod. Before World War II, the price level displayed no overall trend; since then, prices accelerated until the 1980s, when the rate of inflation slowed. The index in 1990 was nearly seven times its 1945 value.
The effect of inflation on asset returns is displayed in both the figure and table. Table 1 presents real return figures for stocks, long-term bonds and short-term bonds—the total nominal return less inflation, for the entire period and the subperiods.

Figure 1 illustrates the real growth of $1 since 1802 for the three asset categories. Because of inflation, real returns are much more modest than nominal returns, especially in the most recent subperiod. One dollar invested in equities in 1802 would have accumulated to $86,100 in real dollars by 1990. Over the same period, one dollar would have accumulated to $520 real dollars if invested in long-term governments, and $242 real dollars if invested in short-term governments.
Accounting for Uncle Sam
The real bottom line for investors is the return after both inflation and taxes. Average federal income tax rates used in this study were taken from a historical study of tax rates. Because no state or local taxes are considered, tax rates before 1913, when the federal income tax was instituted, are set at zero. It is assumed that dividends and interest income are taxed at the average marginal tax rate prevailing in the year earned, and that capital gains are taxed (and losses remitted) at one-fifth the prevailing average marginal tax rate. The reduced tax rate on capital gains arises primarily from the deferment of taxes on gains accrued but not realized and secondarily from the lower tax rate on realized gains.
Table 1 indicates the returns after inflation and taxes for the three asset classes; Figure 1 illustrates the value of $1 after inflation and taxes.
Because a significant part of the returns on equity has been earned through capital gains, while virtually all the returns on bonds are in the form of taxable interest, the returns on equity are taxed at a lower effective rate than those on fixed-income securities. In the third subperiod, 1926 through 1990, when taxes became significant, the compound aftertax real return on stocks is reduced by 1.1 percentage points, to 5.3%; the aftertax real return on short-term bonds is reduced by 0.8 percentage points, to –0.3%, while the return on long-term government bonds falls 1.2 percentage points, to 0.2%.
These results indicate that, on an aftertax basis, investors rolling over long-term bonds in the third subperiod have barely kept up with inflation, while those rolling over short-term bonds have fallen behind inflation. In fact, investors in short-term bonds have earned no aftertax real return from 1900 through 1990. Over the same period, the aftertax real return index for equities increased ninetyfold!
The Dominance of Stocks Over Bonds
Glancing at the long-term (over 30 years) real returns over the various subperiods in Table 1, two striking aspects stand out: the real returns for equities are relatively constant, while fixed-income real returns have dropped substantially. These patterns, of course, could be particular to these time periods. However, an analysis of all 30-year holding periods over the entire period [these results do not appear in the tables here] supports these indicated patterns.
Over every 30-year period from 1802 through 1990, there have been only two when the compound real annual rate of return on stocks fell below 3.5%, and those occurred in the depths of the Depression, in 1931 and 1932. The periods of the highest real returns on stock ended in the early 1960s, when the real compound annual return exceeded 10%. This implies that, although inflation increased substantially, the nominal return on equity increased by an almost identical amount, so the return after inflation remained essentially unchanged. To the extent that stocks are claims on real assets, they might be expected to be good hedges against inflation over the long run.
The other striking pattern is the decline in the average real return on fixed-income assets. In all 30-year periods beginning with 1888, the real rate of return on short-term governments has exceeded 2% in only three periods, ending in the Depression years 1932–1934. Since the late 19th century, the real return on bonds and bills over longer holding periods has almost never matched the average return of 5% reached during the first 70 years of this sample period.
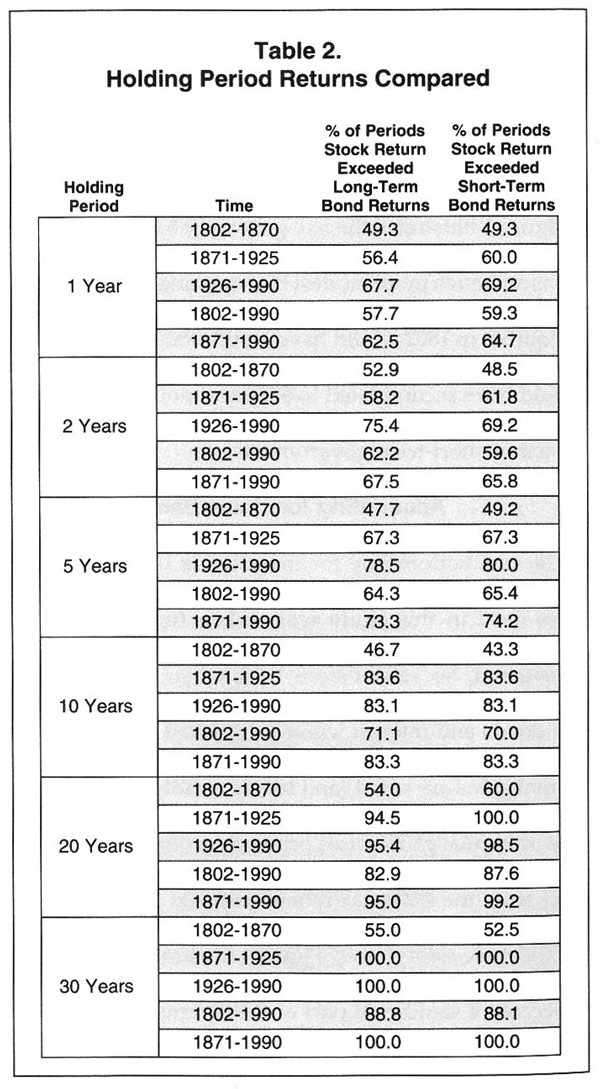 The dominance of stocks over fixed-income securities so evident from Figure 1 and Table 1 is also borne out by examining long-term holding period returns. Table 2 compares compound returns on stocks, long-term bonds and short-term bonds over various holding periods. Over the entire period, stocks outperformed long-term bonds 57.7% of the time on a year-to-year basis, but 88.8% of the time over 30-year horizons. Since 1871, over holding periods of 20 years or longer, stocks have underperformed short-term assets only once and have outperformed long-term bonds 95% of the time. Even with holding periods as short as five years, stocks have outperformed long- and short-term bonds by a four-to-one margin since 1926 and a three-to-one margin since 1872. In contrast, from 1802–1870, stocks outperformed short- or long-term bonds only about half the time over any holding period.
The data demonstrate that returns on equities have compensated investors for increased inflation over the postwar period, while the returns on fixed-income securities have not.
Conclusions
The decline in the real return on fixed-income investments has meant that the advantage of holding equities, which have experienced a remarkably steady real return, has increased over time. The primary source of this premium has been the fall in the real return on bonds, not the rise in the return on equities.
The high real interest rates in the 19th century may have reflected the possibility that the U.S. would default on its bonds or abandon the gold standard. Conversely, the low real rates during much of this century may be explained by a combination of historical and institutional factors, including a legacy of risk-aversion brought on by the 1929–1932 stock market crash and the Depression, as well as governmental policies and controls on interest rates.
Since the inflation shocks of the 1970s, fear of outright default has been replaced by an inflationary premium in nominal interest rates. The period since 1980 contains the highest real long-term bond returns during any consecutive 10-year period since 1884 and the highest short-term bond returns since the 19th century (except the sharp deflationary periods of the Depression).
While the last 10 years represent only about 5% of the total time examined in this study, it is not totally unreasonable to assume that the current higher real rates for bonds will turn out to be more characteristic of future returns than the unusually low real rates of the earlier part of this century. If they do, then the advantage of holding equities over bonds will shrink from the levels reached over the past several generations, and the holders of fixed-income investments should enjoy enhanced real returns.
Even if the real returns for bonds bounce back to 19th century levels, however, the bottom line for investors is that equities still appear to be the best route to long-term wealth accumulation.
This article is based on a longer article that originally appeared in the January/February 1992 issue of the Financial Analysts Journal.
Discussion
FREE REPORT

Bud from WA posted over 7 years ago:
You need to log in as a registered AAII user before commenting.
Log InCreate an account