

Related

Portfolio Strategies
Investors price stocks for higher return because of their higher risk and dividend growth, but downturns can make bonds more favorable because of their contractual payments.
by Brian Haughey | April 2019

The common stock issued by a company is riskier than its debt, since equity is lower in the firm’s capital structure, meaning that it has a subordinate claim to the firm’s cash flows. In other words, interest and principal gets paid to bondholders before equity holders receive anything. Conventional finance theory tells us that, because of this increased risk, shareholders in the firm demand a return, referred to as the “required return,” that is higher than the yield they would require on the firm’s bonds. The difference between the two rates of return is known as the equity risk premium, and according to finance theory this premium is always positive.
But despite the positive equity risk premium, will equity always outperform bonds in the long run? Professor Edward McQuarrie sifted through history to show that there have been prolonged periods during which bonds outperformed. (See “Stock Market Charts Your Never Saw,” for instance, on SSRN.com.) His findings are not entirely surprising but probably not a cause for concern.
In a rational market, investments that are more risky promise higher returns than safer ones do. For example, suppose that the U.S. Treasury issued a one-year bill, offering a return of 5%. Since Treasury bills are issued at a discount, an investor would pay $95.24 ($100 par value divided by one plus the interest rate of 5%):
$100 ÷ (1 + 0.05) = $95.24
At maturity the investor would receive $100, for a gain of $4.76 ($100 par value minus the purchase price of $95.24), representing a 5% return on the investment:
$4.76 ÷ $95.24 = 0.0499 = 5%
Now imagine that a firm, ACME Inc., also issued a 5%, one-year note at the same par value of $100 and priced at the same $95.24. Since there is a chance that ACME might go out of business and default on the note, a rational investor would opt for the Treasury bill that promised the same 5% return but with effectively no default risk.
Suppose there is a 1% chance that ACME will default. That means that 99% of the time the investor would receive $100 at maturity, but 1% of the time they would receive nothing. We can therefore calculate that the expected future value of the ACME note is $99.00. The math is a 99% chance of full payment times par value of $100 plus a 1% chance of full default times zero payment:
(0.99 × $100) + (0.10% × $0) = $99.00
At the price of $95.24, the investor who expects to receive $99 would be earning $3.76 ($99 expected future value minus $95.24 price) for an actual yield of 3.95% ($3.76 ÷ $95.24). Since this is less than the 5% promised by the Treasury bill, no rational investor should buy the ACME note at the asking price of $95.24. In fact, the price would have to drop to $94.29 [$99 ÷ (1 + 0.05)] to attract investors. At that price, the ACME note’s promised yield would be 6.06%:
($100 – $94.29) ÷ $94.29 = 0.606 = 6.06%
Its expected yield, taking default risk into account, would be 5%.
The investor should, all else being equal, be indifferent to holding the 5% Treasury bill or the 6.06% ACME note. In reality, of course, the default risk of ACME is unknown at inception and it may change over time. (For securities with maturities longer than a year, the timing of a default would be another source of uncertainty.) We should also point out that a portion of the principal may be repaid, so that the loss could be less than 100%. Investors, however, may also be concerned about liquidity—that is, their ability to sell the ACME note prior to maturity if they choose to do so. Due to these uncertainties, the yield required by an investor is likely to be even higher than the rate we calculated.
When determining the value of future cash flows on a security that has default risk, an investor should use a risk-adjusted discount rate greater than that used on a Treasury bill, note or bond. This is why $100 to be paid in a year by the U.S. government would be, in effect, considered to be worth $95.24 today in our example, whereas $100 promised in a year by ACME would be worth only $94.29 today. The difference is due to the premium of 1.06% (6.06% – 5.00%) in the discount rate, which compensates for the possibility of default and is a function of both the risk of the issuer and the maturity of the investment.
Now let us turn our attention to stocks. While there are several different ways to value a firm’s shares, one common method is to calculate the present value of the firm’s expected future dividends, by discounting them at the appropriate risk-adjusted discount rate, using the dividend discount model (which is also known as the Gordon Growth Model). In this model, the value of a stock that pays dividends is:
Value = D1 ÷ (k – g)
Where:
The risk-adjusted discount rate is the compensation an investor demands for parting with the invested dollars over a period of time adjusted for the risk of losing some or all of the money. If a firm does not pay dividends, investors can instead use another discounted cash flow (DCF) approach to calculate the present value of the firm’s projected future earnings, free cash flow or some other substitute to determine the value of the stock. [See “Calculating Intrinsic Value With the Dividend Growth Model” in the March 2014 AAII Journal for examples of other models.]
For example, suppose a firm paid a $5 dividend this year and is expected to grow its dividend at a rate of 4% a year into perpetuity. The investor uses a risk-adjusted discount rate of 10% (which approximates the long-term return of large-cap stocks). Next year’s dividend should be $5.20 ($5 current dividend times 1 plus 4% projected growth rate). Based on this, the stock would be worth $86.67. The math is:
[$5 × (1 + 0.04)] ÷ (0.10 – 0.04) = $86.67
Clearly, the value of the firm depends on the growth assumption. If the investor expects dividends to grow at 5%, for example, then the stock would be worth $105:
[$5 × (1 + 0.05)] ÷ (0.10 – 0.05) = $105.00
That is not surprising: An investor would pay more for a stock that they expect to pay them more in dividends. The stock’s value also depends on the risk-adjusted discount rate; a higher rate ascribes less value today to future dividends. If dividends grow at a rate of 4%, but we use a discount rate of 15% instead, the stock’s value would fall to $47.27:
[$5 × (1 + 0.04)] ÷ (0.15 – 0.04) = $47.27
The price is lower in this example because the higher discount rate reflects greater perceived risk.
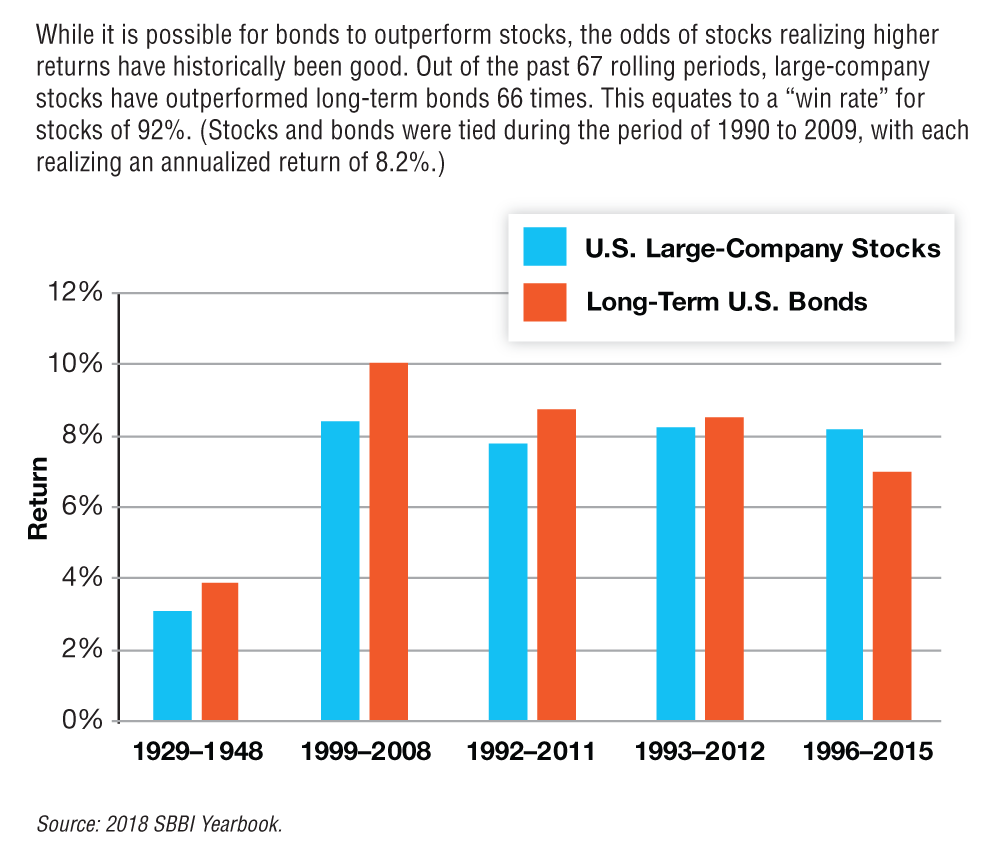
FIGURE 1
Stocks Versus Bonds: The Long-Term Record
Over the long term, stocks beat bonds when it comes to annualized returns. Though stocks have historically been better at creating wealth, they have also been more volatile, as the chart on the top shows.

The return that an investor earns on any investment is a function of the price paid. In our last example, the investor who pays $47.27 for the stock will earn a 15% return, year after year, if dividends continue to grow at 4%. We can easily demonstrate this by calculating the value of the stock one year from now. Its value will be based on the dividend two years from now, so the stock will be worth $49.16. The math is:
($5 × 1.042) ÷ (0.15 – 0.04) = $49.16
A stock’s value is always based on the dividend one year from the valuation date. The value in one year’s time depends on the dividend two years from now. In this example, we use the current dividend of $5, growing for two years at 4%.
A future purchaser would be willing to pay that price if they used the same discount rate and dividend growth assumption, so our investor could sell the stock for a $1.89 gain. Before selling, they would also collect next year’s dividend of $5.20. In total, they would realize a 15% return (dividends plus capital appreciation divided by purchase price):
($5.20 + $1.87) ÷ $47.27 = 0.149 = 15%
A critical point that escapes many investors is that if markets are rational, there are only two reasons why the investor in our example paying $47.27 would not earn a 15% return, year after year. Either dividends grow at some rate other than what is assumed, or when investors ultimately sell the stock, the subsequent purchaser uses different dividend growth or risk-adjusted discount rate assumptions to arrive at the price they are willing to pay. [In practice, investors tend to base their risk-adjusted discount rate assumption on a stock’s beta (relative level of volatility) at the time of purchase.]
Note that an investor who used a risk-adjusted rate of 10% to arrive at a value of $86.67 for the same stock and bought it at that price would earn a 10% return, assuming dividends continued to grow at 4%.
While many textbooks, and most practitioners, view stocks and bonds as quite different animals, they are in fact closely related, each representing a claim on assets of the firm with the value of each being a function of the financial health of the firm. The key difference between them is that bond cash flows are contractual obligations and must be paid, whereas dividends on stock, both preferred and common, are not. Dividends are paid at the discretion of management. Rational management should, however, overwhelmingly choose to continue to pay dividends if there is sufficient cash to do so. [See “The Factors Driving Dividend Policy” in the September 2017 AAII Journal.]
Investors who choose stocks do so because of their residual claim on a firm’s earnings; while coupon payments on bonds are generally fixed, earnings typically increase over time and result in dividend growth that is higher than originally assumed and that is ultimately reflected in stock appreciation. (An additional benefit for an equity investor is that their return is a function of both income and capital gains, the latter being recognized when the stock is sold. While the return to a bond investor is typically taxed as income, long-term capital gains on stock are taxed at the lower capital gains rate.)
Whether or not the equity investor actually earns the “required return” discussed in textbooks depends on the dividends paid, which are a function of the firm’s net earnings, once debts, taxes and other expenses have been paid. We can explore whether dividend growth is likely to be different than that assumed by monitoring current business and economic conditions and using ratios such as return on equity (ROE, or net income divided by equity) and payout (dividends per share divided by earnings per share) to calculate the sustainable growth rate for dividends. [A company grows when new equity is created from the reinvestment of earnings, which is measured by the retention ratio (one minus the payout ratio) and what earnings are generated by that new equity, measured by ROE.] As the firm’s fortunes change, the growth rate can change.
If we accept that a rational firm, not in financial distress, will always pay interest and principal on its bonds, because it must, and will always choose to pay dividends on its stocks when it has sufficient resources to do so, we can then focus our attention on the borderline case. What happens if the firm has just enough cash to pay current dividends, but its business suffers a downturn resulting in reduced earnings and insufficient cash to continue paying dividends at the current level? Management must, sooner or later, respond by reducing or terminating the dividend.
The reduction in earnings would cause the bond to become somewhat riskier, since the firm would generate less cash. In the short term, the bond’s price may drop to reflect this increased risk. As long as the firm continues to generate enough cash to pay interest and principal, however, an investor who holds the bond to maturity will, in the absence of any change in market interest rates, continue to earn their promised yield. (In reality, if the slowdown is economy-wide, interest rates are likely to drop and so the investor will earn less on their reinvested coupons. But the investor’s total return will most likely still be positive.)
Dividend Discount Model
The constant growth dividend discount model (also known as the Gordon Growth Model) assumes that a company is growing at a constant rate. It is best used for large, stable companies that have consistent earnings and dividends. However, small- and medium-sized firms that are growing their earnings and dividends steadily can be valued using this approach as well. The formula for the constant growth model is:
Stock price = D1 ÷ (k – g)
Where:
As with any model, the output generated is only as good as the quality of the factors going into the calculation. Dividends and earnings information is widely available, but the required rate of return and growth rate of dividends require assumptions to be made.
A common formula for estimating the possible required rate of return is:
Required rate of return for equity = risk-free rate + (market risk premium × beta for equity).
 The risk-free rate used in this calculation is the yield on long-term Treasuries, such as a 30-year Treasury bond. The reasoning behind using a long-term bond is that equities are thought of as indefinite holdings; therefore, the risk-free rate should be a very long-term risk-free rate. According to Ibbotson Associates, long-term Treasuries annualized a total return of 5.5% over the 90-year period ending in 2017.
The market risk premium is the expected return of the stock market less the risk-free rate. In short, it is the return required to entice investors to purchase risky assets instead of simply purchasing risk-free assets. A good estimate of this figure is the historical market risk premium of the S&P 500 index.
According to Ibbotson Associates, the S&P 500 gained 10.2% annually over the same 90-year period. Therefore, the market risk premium is 4.7% (10.2% – 5.5%). It is worth noting that there are a number of economists who believe our stock market will not be able to achieve the same type of returns we have experienced over the long run. However, this opinion is hard to substantiate, and using a long-term historical market risk premium is considered a sound procedure.
—AAII
The equity investor, however, would see the value of their shares drop, for two reasons. First, the stream of dividends would no longer grow as expected, but would likely be reduced or even terminated and the stock’s present value would drop. Second, since the firm is riskier, the risk-adjusted discount rate should increase, further reducing the present value of future dividends. The equity investor’s return would drop below what they expected (which was equal to the risk-adjusted discount rate) since their current income, in the form of dividends, would diminish. The investor would see reduced—or even negative—capital gain, due to the decrease in the value of the stock.
If the reduction in the firm’s earnings, and consequently in its dividends, continued year after year, the value of the stock would also continue to drop each year in lockstep. It’s possible, of course, that the market might anticipate this continued deterioration in the firm’s fortunes and drive the stock price down below that projected by the dividend discount model.
If such a downturn were to occur across multiple firms, the broad bond market would likely continue to show positive returns, while the broad equity market would show negative returns. One could argue that the Federal Reserve would respond to such a broad slowdown by cutting rates or by implementing some other stimulus, thereby possibly reducing the risk-adjusted discount rate. Nevertheless, a prolonged period of declining equity prices, over a period of multiple years, despite positive bond market returns, is a plausible scenario.
Are we likely to see a period of McQuarrie-esque returns where stocks realize lower returns relative to bonds over the 30 years? Such a scenario is only likely if long-term earnings growth for stocks is substantially less than what is currently anticipated. Favoring stocks is the favorable energy situation in the U.S., the arrival of the long-anticipated productivity dividend of technology spending (as evidenced by the growth in artificial intelligence, big data, virtualization, robotics and autonomous machines) and the general growth in economic activity due to human ingenuity and innovation. These should help long-term earnings and dividend growth.
Both earnings growth and dividends have historically helped stocks to outperform over the long run, as Figure 1 shows. Blending bonds with stocks in a portfolio has tended to reduce volatility, with falling rates since the late 1980s helping to boost the returns of bonds.
Portfolio Strategies

Financial Statements
Steve from Ohio posted over 7 years ago:
Steve from IL posted over 7 years ago:
John Lambert from NJ posted over 7 years ago:
Brian from NY posted over 7 years ago:
JLC from SD posted over 7 years ago:
You need to log in as a registered AAII user before commenting.
Log InCreate an account