

Related

Stock Strategies
Does value investing still work? An in-depth look at the numbers shows that the answer is more nuanced than you might think.
by Charles Rotblut | May 2019

Charles Rotblut leads a class in AAII's new Essential Investing Video Course. Go to https://www.aaii.com/ves for more information and to subscribe.
Value-oriented mutual funds, on average, have been lagging both their broader market benchmarks and their growth-oriented competitors. During the five-year period ending on December 31, 2018, the average value-oriented large-cap fund listed in our annual Mutual Fund Guide (February 2019 AAII Journal) realized an annualized gain of 5.2%. In contrast, the average large-cap growth-oriented fund gained 8.3% on an annualized basis.
The difference in performance can be seen in the major indexes as well. The S&P 500 Pure Value index, a subset of the broader S&P 500 index, had a five-year annualized return of 5.1% through the end of 2018 versus 8.2% for its counterpart, the S&P 500 Pure Growth index. On a 10-year basis, the S&P 500 Pure Value index gained 16.3% versus a 16.9% annualized rise for the S&P 500 Growth index. (S&P Dow Jones Indices lists first-quarter 2019 returns for the two indexes as 11.8% and 16.6%, respectively.)
The disparity in returns can be seen among smaller companies too. The Russell 2000 Value index had a 3.6% annualized five-year return as of the end of December 31, 2018, versus a 5.1% gain for the Russell 2000 Growth index. The 10-year annualized returns for the two indexes were 10.4% and 13.5%, respectively.
These comparisons have led to questions about whether value investing still works and how long the current level of underperformance will continue. Just last month, Barron’s published an article describing the current market cycle as “testing the resolve of even the most dedicated disciples” of value investing (“Value Investing Will Beat Growth Again—but Maybe Not for Years to Come,” Barron’s, April 5, 2019).
Given the recent performance and commentary surfacing about value investing, we decided to look at the numbers, both long-term and shorter-term. What we found is a story that is more nuanced than headlines would suggest. We show the data and add our thoughts to help you gain more insight.
Before we dig into the numbers, a bit of perspective is warranted. This isn’t the first time that value has lagged growth, nor will it be the last. All strategies fall out of favor over potentially frustrating periods of time. The ones with good long-term track records, and both a fundamental and behavioral reason why they work, do swing back into favor. Value has historically worked because investors underestimate the earnings power of cheaper stocks and overestimate the earnings power of more expensive stocks. At the same time, value stocks often lack the alluring story that growth stocks have, making them appear less desirable. Over time, these mispricings are corrected, leading value to outperform.
Our analysis uses data from Dartmouth professor Kenneth French’s online data library. French provides annual (and monthly) return data on stocks categorized by their price-to-book-value, price-earnings and price-to-cash-flow ratios. He also has data on stocks based on their dividend yield. The length of time his data goes back depends on the indicator. Data on the price-to-book ratio and dividends-to-price ratio is available back to 1927 and 1928 respectively, while data on the price-earnings ratio and the price-to-cash-flow ratio is only available back to 1952.
Table 1 shows the long-term returns for each. We looked at two specific groups from French’s data to see how value (the cheapest stocks) faired against growth (the most expensive stocks). The first is the cheapest third of stocks versus the most expensive third. The second is the cheapest quintile (20%) versus the most expensive quintile (20%) of stocks. The nomenclature in the financial services industry is to label what has a low valuation ratio as value and what has a high valuation ratio as growth. In reality, a stock could have a high valuation ratio but little or no actual growth. For purposes of our discussion and in light of the broader discussion occurring in the industry, we stick with value versus growth. We also focus on the cheapest third against the most expensive third of stocks for each valuation measure, except where expressly stated otherwise.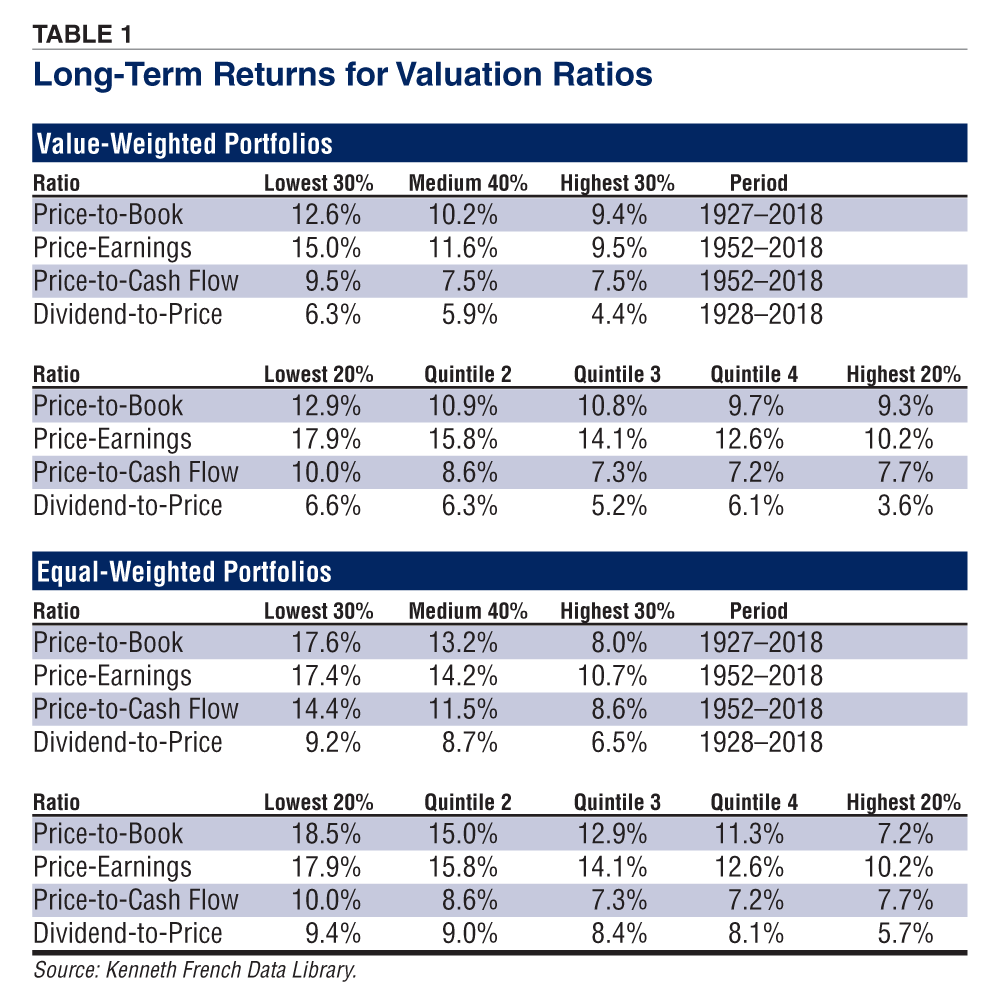
There is no single ratio accepted as the defining indicator of what qualifies a stock as being value or growth. The price-to-book-value ratio has the longest history of being an accepted measure. The ratio was popularized in the 1930s by Benjamin Graham and David Dodd in their book, “Security Analysis.” The price-to-book ratio has since developed a following among value devotees and has been widely used by academics. The ratio is calculated as the share price divided by book value (equity) per share. It can also be calculated at the company level, which is what French does. The ratio is market capitalization (or market equity, ME) divided by book equity (BE). (Technically, French uses the inverse, or BE/ME; more on that momentarily.)
The price-earnings ratio is more frequently used in modern times as a measure of valuation. It is an easy-to-grasp ratio showing how many times current (or projected) earnings a stock is trading at. The traditional price-earnings ratio is calculated by dividing a stock’s price by earnings per share.
Less widely used is the price-to-cash-flow ratio. This ratio assesses a stock’s valuation based on how much cash a company has realized over a period of time. Measurements of cash flow vary. French defines cash flow as “total earnings before extraordinary items, plus equity’s share of depreciation, plus deferred taxes (if available) for the last fiscal year end.” Net cash flow from the cash statement can also be used. Regardless of how cash flow is defined, the ratio is calculated by dividing the share price by cash flow per share.
Those in academia tend to use the inverse of the first three measures. French’s database, for instance, lists book equity/market equity, earnings/price and cash flow/price. They’re all similar to the previously mentioned ratios; the numerator and the denominator are flipped. A stock with a low price-earnings ratio (P/E) can also be described as having a high earnings-price (E/P) ratio. Either way, the stock is still cheaply valued.
Dividend yields also serve as a valuation measure. Similar to bond yields, higher dividend yields indicate a greater stream of income relative to the price paid. Dividend yield is calculated as dividend payments divided by the stock price.
Other measures exist. We believe focusing on the aforementioned measures, particularly the first three, provide enough insight on performance to give a proper overview of current and long-term performance.
French’s data uses both value weighting and equal weighting. The former is proxy for size, with larger companies having more influence on returns than smaller companies. The latter allows all companies to have an equal influence on the returns. We looked at both.
The one thing the data was clear on was that those investors who were willing to stick with a broad, diversified universe of value stocks have been rewarded for doing so.
Between 1927 and 2018, the cheapest price-to-book stocks handily beat their most expensive brethren: 17.6% annualized gains versus 8.0% annualized gains on an equal-weighted basis. The gap was much narrower on a value-weighted basis, though still significant: 12.6% versus 9.4% on an annualized basis. Both sets of returns compare the cheapest third of stocks versus the most expensive third. Using quintiles did not significantly alter the comparisons.
As noted previously, the data on price-earnings ratio and price-to-cash-flow ratio only dates back to 1952. Over the last 67 years, stocks with low price-earnings ratios have realized an annualized return of 17.4% versus 10.7% for stocks with high price-earnings ratios on an equal-weighted basis. On a value-weighted basis, the comparison is 15.0% versus 9.5%. For the price-to-cash-flow ratio, the long-term annualized equal-weighted returns are 14.4% versus 8.6%, respectively. The comparable value-weighted returns are 9.5% versus 7.5%. Though closer, they still give a significant edge to value.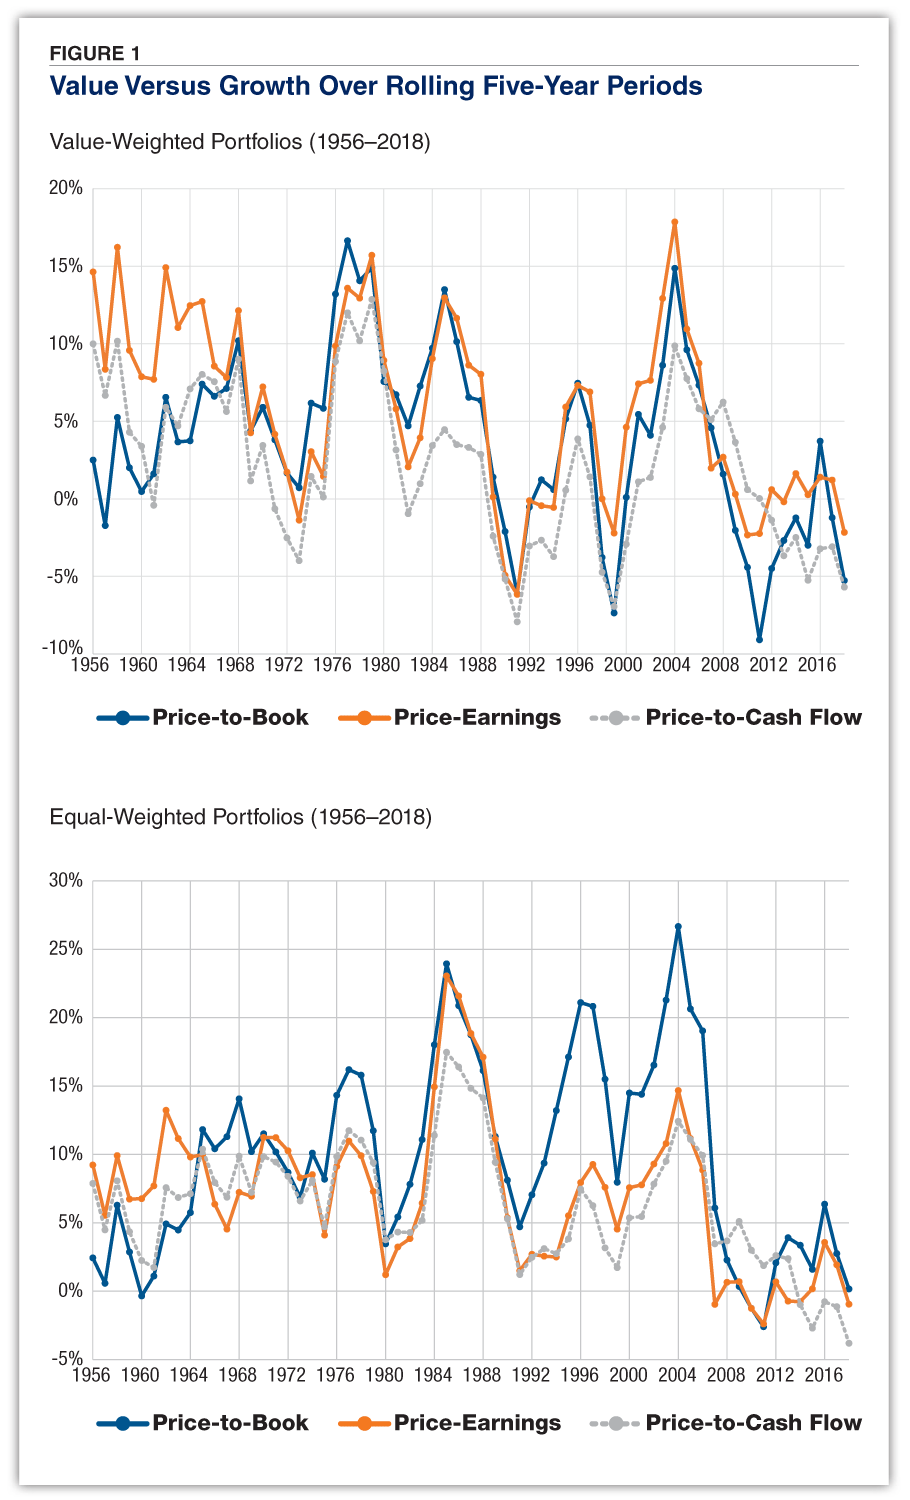
Since some of you may want an apples-to-apples comparison for the price-to-book ratio, we calculated it using the period of 1952–2018. The equal-weighted difference in annualized returns is 17.2% versus 8.2%. On a value-weighted basis, the difference is 13.5% versus 10.1%.
Adjusting the calculations to track rolling 20-year period returns still shows strong outperformance for value. Low price-to-book stocks have outperformed high price-to-book stocks during all 74 rolling 20-year periods, including 1999 through 2018. The record holds regardless of whether value weighting or equal weighting is used.
The price-earnings ratio has also consistently worked well over the long term. Stocks with low price-earnings ratios have outperformed stocks with high price-earnings ratios during all 48 rolling 20-year periods from 1952 through 2018.
The comparisons aren’t flawless but are still very good for the price-to-cash-flow ratio. On an equal-weighted basis, low price-to-cash-flow stocks have outperformed high price-to-cash-flow stocks during all 48 rolling 20-year periods. On a value-weighted basis, the record drops to 43 out of 48. This is still a high win rate of 90% though. Growth topped value over the periods of 1979–1998, 1980–1999, 1981–2000, 1984–2003 and 1985–2004.
The premise of cheap outperforming expensive broke down when dividend yield was looked at. Overwhelmingly, portfolios of stocks with lower yields performed better than those with higher yields. An equally weighted portfolio of stocks whose dividend yields ranked in the bottom 30% realized a 9.2% annualized return over the past 91 years. In comparison, an equally weighted portfolio of stocks whose dividend yields ranked in the top 30% returned just 6.5%. The gap was smaller for the value-weighted portfolios, though still favored lower-yielding stocks (6.3% annualized) over the higher-yielding stocks (4.4%).
(Stocks not paying a dividend outperformed the dividend payers. The annualized return was 8.0% on a value-weighted basis and 12.0% on an equal-weighted basis. When the universe of stocks was divided into three groups of dividend payers—lowest 30%, medium 40% and highest 30%—and non-dividend payers, the non-dividend-payer group was generally the largest single group in terms of the number of stocks. The exception was a period of time between the early 1940s and the mid to late 1960s.)
High-yielding stocks have only beaten low-yielding stocks four times out of the past 73 rolling 20-year periods on an equally weighted basis. Three of four periods of outperformance were the years of 1956–1975, 1957–1976 and 1958–1977. In other words, they ended during years of high inflation. On a value-weighted basis, portfolios with the highest 30% of dividend yielders bested portfolios with the lowest 30% of dividend yielding stocks just 12 times out of the past 73 years. Only two of those have occurred in periods ending in this century: 1992–2011 and 1999–2018.
There are a couple of reasons that could explain why the highest-yielding stocks have lagged those with lower yields. One may have to do with financial problems. High yields may reflect expectations among investors about the prevailing dividend not being sustainable. To the extent these companies cut or suspended their dividend, their stocks may have returned less than the majority of other stocks. Another reason may be that stocks in this group belong to less economically sensitive sectors and industries. To the extent their stock prices are more stable, it could hurt their comparable returns. This would explain why high dividend stocks have performed comparatively better over five- and 10-year rolling periods, though still trailing more frequently than leading. In both cases, French’s data lacks enough detail to draw definitive conclusions.
The story becomes more nuanced when five- and 10-year rolling periods are used.
Consider the price-to-book ratio. Equal-weighted portfolios of low price-to-book stocks have beaten similar portfolios of high price-to-book stocks during all 83 of the past 10-year rolling periods. The story changes when value weighting is used. Low price-to-book stocks have outperformed during just 82% of all 83 rolling 10-year periods. Notably, approximately half of the 15 periods when value has underperformed have occurred in this decade. Growth has done better on a value-weighted basis during every 10-year period ending between 2011 and 2018.
On a rolling five-year basis, we see similar patterns. Value-weighted portfolios of low price-to-book stocks have outperformed high price-to-book stocks 65 times out of the past 88 rolling five-year periods, a win rate of 74%. Value has underperformed growth nine times out of the past 10 rolling periods (five-year periods running from 2005–2009 through 2014–2018).
The tide appeared to turn against value in 2007. As illustrated in the top chart in Figure 2, which shows calendar-year returns between 2007 and 2018, a value-weighted portfolio of cheap stocks underperformed a similar portfolio of growth stocks on a calendar-year basis nine times. (The exceptions were 2012, 2013 and 2016.) This period included the only span when value underperformed for five consecutive years: 2007, 2008, 2009, 2010 and 2011. It’s possible that the type of stocks most affected by the financial crisis and resulting Great Recession played a role.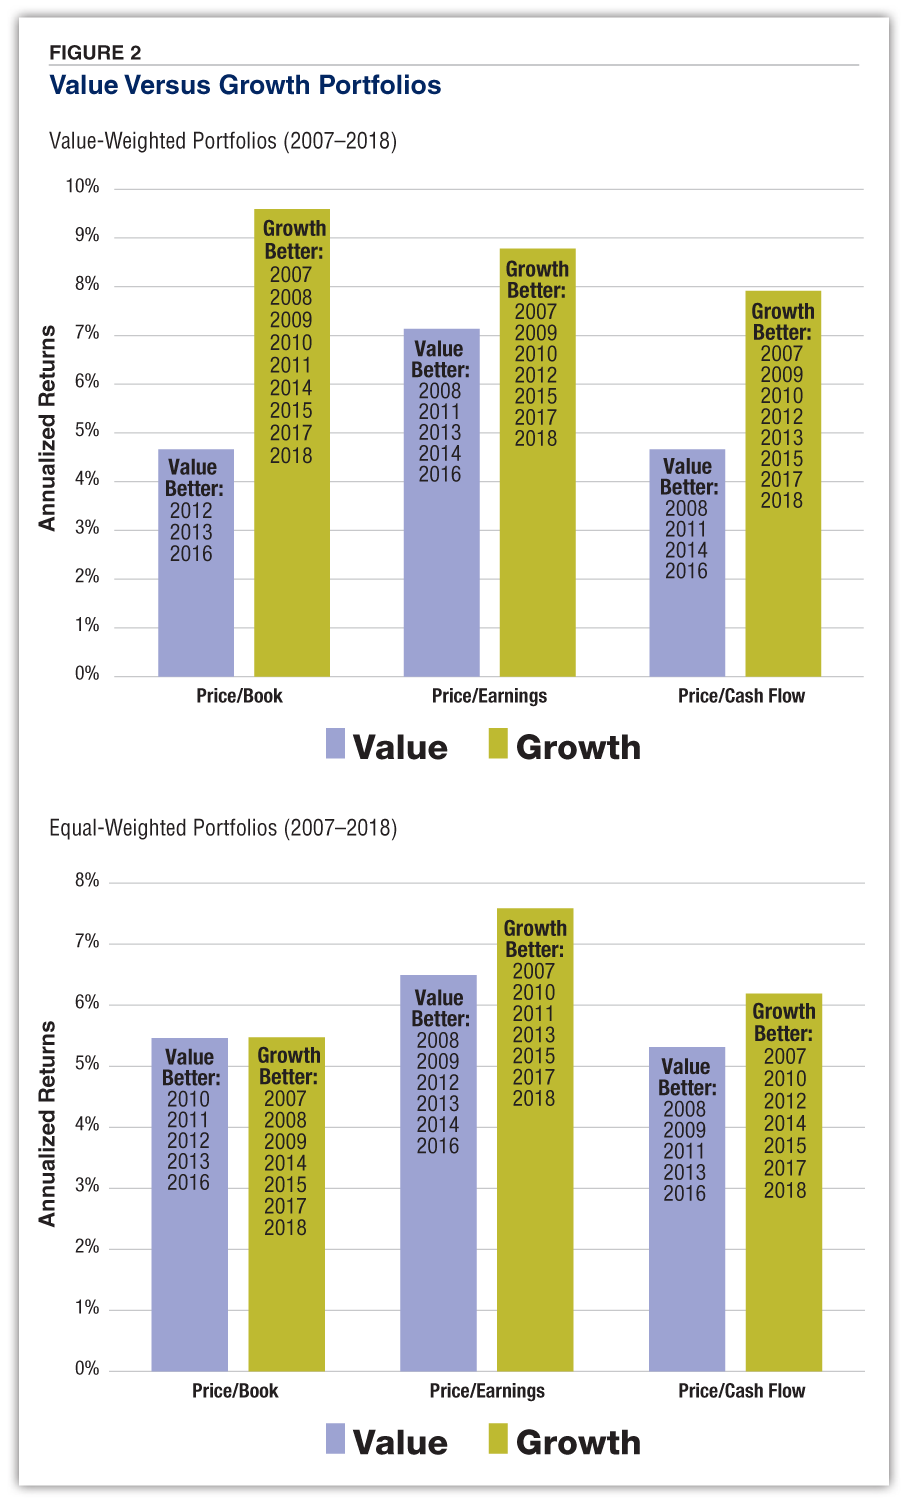
The same pattern isn’t as strong when the portfolios are equally weighted. Rather, value’s win rate is 93% (82 out of 88 rolling five-year periods). Since the start of the new millennium, low price-to-book stocks have only beaten high price-to-book stocks twice: 2006–2010 and 2007–2011. The bottom chart in Figure 2 shows that, between 2007 and 2018, low price-to-book portfolios outperformed during five calendar years (2010, 2011, 2012, 2013 and 2016) while high price-to-book portfolios did better seven times.
Value-weighted portfolios formed using the price-earnings ratio also show a recent history of underperforming. Since 2007, low price-earnings portfolios have outperformed their high price-earnings counterparts just five times (2008, 2011, 2013, 2014 and 2016).
Low price-earnings stocks have historically performed well on a five-year rolling basis, beating high price-earnings stocks during 52 out of all 62 periods on a value-weighted basis. Four of the 10 periods when value lagged have occurred during periods ending after 2007 (2006–2010, 2007–2011, 2009–2013 and 2014–2018). Even on a 10-year rolling period basis, we see the recent weakness. Three of the five 10-year periods when value lagged ended in 2015, 2016 and 2018.
Notably, similar patterns exist with equal-weighted price-earnings portfolios, unlike with the price-to-book ratio.
The overall story isn’t much different for the price-to-cash-flow ratio. Value-weighted low price-to-cash-flow portfolios have topped high price-to-cash-flow stocks during only four out of the last 12 calendar years (Figure 2, top).
On a rolling five-year basis, value-weighted low price-to-cash-flow portfolios are on a seven-consecutive-period streak of underperforming their more expensive counterparts (2008–2012 through 2014–2018). This streak of underperformance followed 11 consecutive five-year rolling periods of value outperforming (1997–2001 through 2007–2011). Low price-to-cash-flow portfolios trailed high price-to-cash-flow portfolios for a stretch of six consecutive rolling five-year periods in the 1980s and 1990s, so there is a prior occurrence of serial outperformance and underperformance on a value-weighted basis.
On an equal-weighted basis, the record of low price-to-cash-flow portfolios beating high price-to-cash-flow portfolios on a rolling five-year period basis was flawless through the period of 2009–2013. Since then, they have underperformed five times. Looking at calendar-year returns, the low price-to-cash-flow portfolios have underperformed during seven out of 12 years.
High dividend yield stocks haven’t fared any better, trailing low-dividend yielders during seven out of the past 12 calendar years on a value-weighted basis. On a rolling five-year basis, value-weighted portfolios of high-yielding stocks have underperformed for four consecutive periods. (The comparative returns are worse when the portfolios are equal-weighted instead.) Streaks of underperformance aren’t unusual, however, given the comparatively weak performance of high yield relative to low yield.
French’s data sorts price-to-book stocks by market capitalization. We reran the numbers looking at both small and big companies to see if company size was playing a role in value’s recent weakness.
Small-company low price-to-book stocks have lagged their growth counterparts during nine out of the last 12 years on a value-weighted basis. In comparison, during the last 92 years, small-company value stocks have outperformed small-company growth stocks 60% of the time (14.5% versus 8.7%). On a five-year rolling period basis, low price-to-book small-company stocks have beaten high price-to-book small-company stocks during 71 out of 88 periods, an 81% win rate.
Large-company low price-to-book stocks have lagged their high price-to-book counterparts during nine out of the past 12 calendar years on a value-weighted basis. Their long-term record is similar to small-company stocks, with large value stocks having outperformed large growth stocks during 54 out of the last 92 calendar years, a 59% win rate. (Annualized returns are 11.8% for large value versus 9.6% for large growth.)
Where the statistics differ is with the equal-weighted portfolios. Portfolios of equally weighted small-company stocks with low price-to-book ratios have outperformed during 68 out of the past 92 periods (a 74% win rate), including seven out of the last 12 years. In contrast, portfolios of equally weighted large-company stocks with low price-to-book ratios have outperformed during 58 out of the past 92 periods (a 63% win rate). During the last 12 calendar years, they have only outperformed four times, however (2008, 2012, 2013 and 2016).
The five-year records are more telling. Equally weighted small-company value portfolios have outperformed during 83 out of the last 88 periods including the last seven consecutive rolling five-year periods. Equally weighted portfolios of large-company stocks with low price-to-book ratios have only beaten their more expensive peers three times since 2007. In fact, they’ve underperformed during nine of the last 10 rolling five-year periods. The only other time value incurred such a drought was between 1931 and 1941. During that time, large, low price-to-book stocks underperformed on a rolling five-year period basis eight out of the 11 times.
Given the long history of value outperforming, one would have to assume that something has both fundamentally and permanently changed in the market environment for value to not come back into style at some point in future.
There are various theories as to why value has lagged. Intangible assets such as network effects [e.g., Apple Inc.’s (AAPL) and Amazon.com Inc.’s (AMZN) ecosystems] are not recorded on balance sheets, thereby a large amount of tangible value is not recognized by investors. Stock buybacks have also been blamed for deflating book value. Neither explains why low price-earnings stocks have lagged, however. The ongoing low-interest-rate environment has been blamed for reducing risk tolerances and thereby leading more investors to invest in growth stocks. Growth may be a factor, particularly if the stocks comprising the value group have, in aggregate, been growing at slower-than-expected rates relative to their higher-valued counterparts.
The rise in passive investing has been suggested as a culprit. When portfolios are sorted by price-to-book ratio and size, we see a trend of small growth companies underperforming large growth companies over the past five consecutive years. Among value stocks, small companies have outperformed large companies during three out of the last five years on both a value-weighted and an equal-weighted basis.
It is also possible that we are simply incurring a value drought. In an email, French told us that “there is a good chance it is just a random outcome.” If this proves to be the case, comparative returns will reverse at some point in the future, with value reverting to outperforming growth. While it can be tough to stick with a style of investing that is currently out of favor, historically, investors who have been willing to pay attention to the long-term data about what is typical and what is unusual have been rewarded.
Stock Strategies

Financial Statements

AAII Stock Ideas

Bill Milam from IN posted over 7 years ago:
Tom Leonard from Florida posted over 7 years ago:
David Wren from Alabama posted over 6 years ago:
Stephen Reh from CA posted over 6 years ago:
Ray Swaback from Missouri posted over 6 years ago:
You need to log in as a registered AAII user before commenting.
Log InCreate an account