

Related

Financial Statements
Ken Fisher proposed a substitute to the price-earnings ratio in the June 1984 AAII Journal, introducing members to the now-common ratio based on price relative to sales.
by Ken Fisher | June 2019

Ken Fisher leads a class in AAII's new Essential Investing Video Course. Go to https://www.aaii.com/ves for more information and to subscribe.
Price-sales (P/S) ratio analysis is a new concept, and yet so fundamentally simple and powerful that many, when first encountering it, wonder why they haven’t heard about it before.
The formula is like that of the price-earnings ratio, except it uses sales instead of earnings. To calculate a stock’s price-sales ratio, you simply divide its price by its sales per share.
For example, a company with $100 million in annual sales that sells for $15 per share and has 5 million shares of stock outstanding has a price-sales ratio of 0.75. If its earnings are 5% per year, its price-earnings ratio is 15.
Price-sales ratios measure the popularity of the stock. This is helpful for a number of investment theories. A long-held standard of such legendary investors as Warren Buffett, Philip Fisher, Benjamin Graham, John Templeton and others is to buy unpopular stocks of good companies. But first, you must know if a stock is popular or not.
It is becoming common to view low price-earnings stocks as synonymous with low popularity. I have nothing against the low price-earnings school and view low price-earnings ratios as a viable way to seek above-average reward at below-average risk. But low price-earnings ratios are not a strong measure of popularity. They are too elastic.
Too much attention is focused on current earnings. Earnings are a result—not a cause. At best, they result from a lot of accounting assumptions trickling their way through an operating company’s books. The basic factors affecting the value of a stock tie more closely into the income statement’s top half—a company’s product position and cost structure allowing it to do a certain amount of business. Employing the price-sales ratio as another tool of analysis helps put stocks in their proper perspective.
High price-sales ratio stocks are popular; low price-sales ratio stocks are unpopular. Let’s see what this means. Price-sales ratios range from numbers below 0.02 (2% of sales) to beyond 30 (30 times sales). Industrials in Chapter 11 bankruptcy, for instance, often sell at price-sales ratios in the 0.02 to 0.05 range. At the other extreme, some of the high-tech wonder companies sell at price-sales ratios ranging from three to 30.
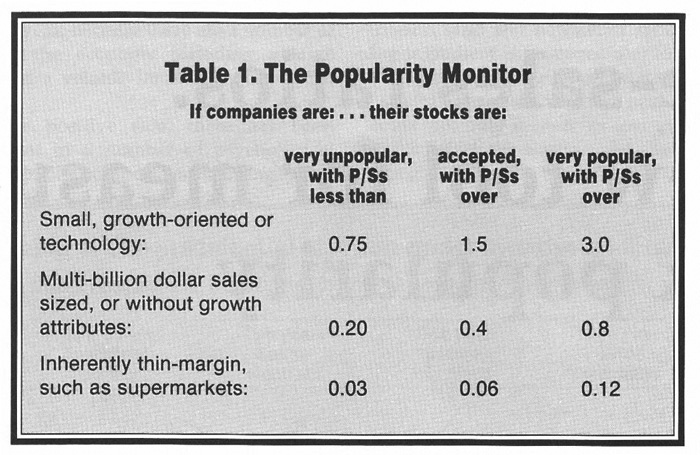
Table 1, “The Popularity Monitor,” shows various levels of popularity associated with different levels of price-sales ratios. The table breaks stocks into three categories. First are small technology/growth-oriented companies. Then, there are big, multi-billion-dollar companies grouped with companies in industries without growth attributes. Finally, we have companies with very thin operating margins—ones whose basic product lines are inherently low-profit-margin activities, such as supermarkets or distributors.
These numbers were empirically derived. It is interesting that in each case there is a price-sales ratio doubling between steps of popularity. The absolute scale of price-sales ratio/popularity seems consistent—two doublings as stocks rise from obscurity to high regard. I have no explanation for this and report it merely as an interesting observation.
High price-sales ratio stocks don’t perform because they are too popular and discount much of the future. Stocks, industries and the economy as a whole swing in long, sweeping cycles of profitability. As a company slowly improves profit margins over the years, investors often confuse growth with margin improvement.
As a company increases its net aftertax margins from 2% one year to 3% the next, absolute profits have risen 50%. The next year it increases margins to 4%, and then the next 5%, and on and on until perhaps eventually it earns 10%, 12% or even 15% net aftertax margins.
Toward the later stages of this process, glowing brokerage firm reports will appear, describing how ABC has grown in earnings per share by an annual average of 35% (or some other large number) over the last five (or some other large number) years. They have confused growth with margin improvement. Few companies can sustain significantly above-average profit margins for long.
Even fewer analysts can tell which companies will maintain profitability. A number of studies have shown that few analysts are accurate with their specific earnings per share forecasts. One study analyzed consensus estimates of brokerage firm analysts from 1977 through 1981, and found the average annual error was over 31%, clearly more than enough to move a stock.
MCI Communications went through this cycle in the 1970s and early 1980s. In 1978 it sold for 80% of sales (price-sales ratio = 0.80). By 1983, as a much larger company, it sold for seven times sales. But in 1983, investors seemed placated by MCI’s exceptional profit margins.
Forecasts of growth abounded, with investors confused between growth in volume and MCI’s double-digit profit margins. Brokerage reports estimated MCI at 30 times trailing earnings and only 18 times the next year’s earnings—which they assumed would prop up the stock. Unfortunately, when MCI’s margins finally crumbled, the stock did too.
Low price-sales ratio stocks can perform because they are unpopular, and virtually any good news translates directly into higher stock prices. Consider the case of Verbatim, which is a small company in a rapid growth area. In 1981 they were less than $50 million in sales, losing money, poorly regarded, virtually without a following on Wall Street and rumored upon occasion as a bankruptcy candidate (in spite of a quite strong balance sheet).
At a price-sales ratio of 0.50, Verbatim was only 10 times future earnings if they could earn 5% margins in the future, or, five times earnings if they could earn 10% margins. As Verbatim retained its 35% market share in floppy disks, it isn’t hard to see the economics of a stock price increase as the personal computer revolution fueled an explosion in the floppy disk market.
Do many good companies sell at such low levels? Hambrecht and Quist is a leading specialty boutique in the field of technology investing. We calculated price-sales ratios for their stocks from 1978 through 1983. In 1978, at the start of the bull market in technology stocks, the highest price-sales ratio in their universe was 2.5. The unweighted average was 0.79. By early 1983, the average was over 4.0 and a significant part of their data universe had price-sales ratios over 10.0. Some were as high as 20 and 30.
As we tracked the universe on a quarter-to-quarter basis, the low price-sales ratio quartile of stocks outperformed the high price-sales ratio quartile in every single quarter for five years.
In one test, low price-sales ratio stocks outperformed the low price-earnings ratio stocks by a wide margin.
In another study, we looked at a statistical piece in the January 1984 issue of Forbes. From it we analyzed the 20 top-performing industrial stocks with 1979 sales over $50 million during the five years from 1979 through 1983. Taking a five-year time frame clearly allows long-term value to prevail over short-term fancy. Some of these companies were losing money in 1979. Others made good margins. We calculated price-sales ratios as of January 1979. The results are presented in Table 2.
Note that 11 of these 20 best-performing stocks started 1979 with price-sales ratios of 0.20 or less. Another four started with price-sales ratios between 0.20 and 0.35. Only two started with price-sales ratios greater than 0.75. The other three spread between ratios of 0.35 and 0.75.
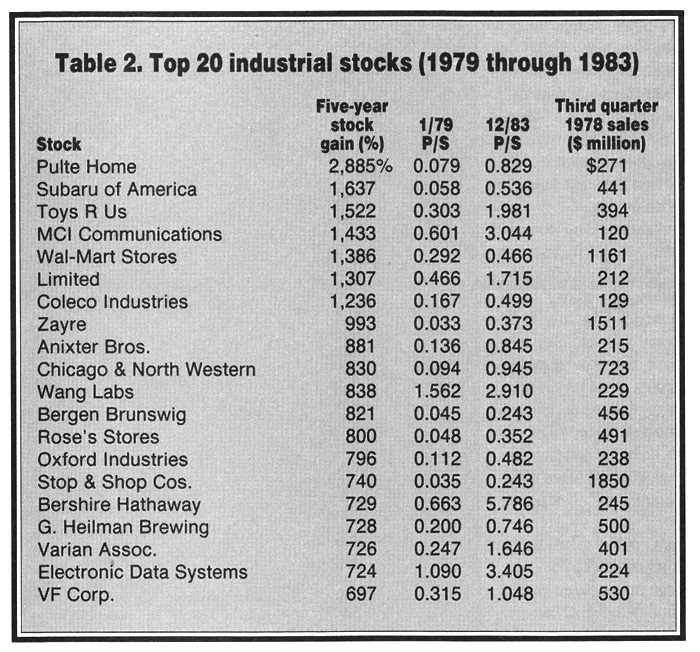
Eight of these 20, including the top two, had price-sales ratio multiple expansions of 700% or more. Pulte Home’s price-sales ratio multiple, for example, increased more than tenfold (1,050%), from 0.079 to 0.829.
Twelve of the 20, including the top four, had price-sales ratio multiple expansions of 500% or more. Some, like Zayre, had price-sales ratio multiple expansions greater than their stock price increases. This is because the price-sales ratio reflects market capitalization, fully adjusting for dilution from any new shares issued.
Obviously, if a stock’s price-sales ratio multiple is to expand 500% to 1,000% it has to start quite low or end up quite high. All but two had price-sales ratio multiple expansions of 300% or more. One of the two firms was Wang Labs, which started with the list’s highest price-sales ratio.
Table 3 lists the results of another study, where we looked at the 1983 percentage gains of the Dow Jones industrial average (DJIA) stocks. That is to say, International Harvester stock rose 177% between January 1 and December 31, 1983; at the same time Goodyear Tire fell 14%. Also listed are their price-earnings ratios for January 1983 as taken from S&P Stock Guide. The sales numbers used in calculating the price-sales ratios were taken from quarterly data from Value Line—again, using then-reported last 12 month’s results. Percentages are rounded to the nearest whole.
We decided to compare the lowest 25% price-sales ratio stocks in the list versus the lowest 25% price-earnings ratio stocks. Unfortunately, there were too many with price-earnings ratios of eight to restrict the low price-earnings ratio list to exactly seven stocks. So, we could either compare the low quartile price-sales ratio group of seven stocks to nine low price-earnings ratios or the nine lowest price-earnings ratios to the nine lowest price-sales ratios. We did both. The asterisks indicate the seven lowest price-sales ratio stocks and the nine lowest price-earnings ratio stocks.
The results:
The low price-sales ratio stocks outperformed the low price-earnings ratio stocks—by a wide margin. The low price-earnings ratio stocks did outperform the DJIA as a whole.
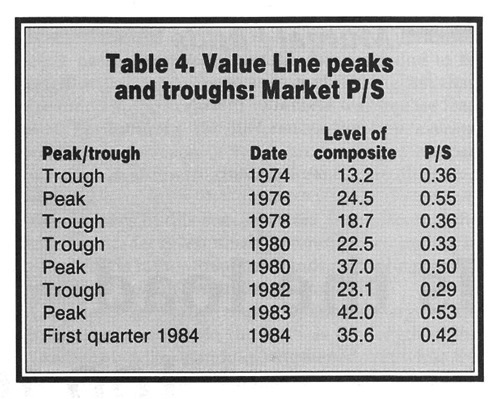
To get an idea of price-sales ratio measures for the market as a whole, we used the Value Line composite to construct price-sales ratios for the major peaks and bottoms of the last 10 years. This is presented in Table 4. (I am skeptical of attempts to time the overall market. I don’t believe you can time the market based on price-sales ratios. If you go further back, over the prior 40 years you get some sharp exceptions to the last decade’s tight repeating pattern.)
Since 1974, the Value Line composite peaked at price-sales ratios of between 0.50 and 0.55. It bottomed out at price-sales ratios between 0.29 and 0.36. This provides some insight into the debate today over whether the market bottomed in early March 1984. If the last decade is any guide, it did not: If the composite as a whole is to reach price-sales ratios in the 0.29 to 0.36 range, many of the individual ratios must be far lower.
It is important to consider a stock’s price-sales ratio when entertaining its purchase or sale. At the same time, keep in mind some hard and fast rules when using price-sales ratio analysis:
Parts of this article are excerpted with permission from book, “Super Stocks” (Dow Jones-Irwin, 1984).
Price-to-Sales Screen in the Stock Ideas area
Valuing a Company Based on Its Revenues by Charles Rotblut, CFA, October 2014
Weight by Fundamentals, Not by Price an interview with Robert Arnott, October 2014
Financial Statements

Value Investing

Charles W McAndrew Jr from PA posted over 7 years ago:
You need to log in as a registered AAII user before commenting.
Log InCreate an account