


Which rebalancing frequency offers the best risk-adjusted return?
History warned us that stocks would likely decline in May following the third-strongest year-to-date advance through April since World War II. Indeed, the S&P 1500 index fell 6.7% in May, officially slipping into pullback territory (a decline of 5.0% to 9.99%), dragging down its large-, mid- and small-cap constituents, along with all 11 sectors and 91% of its 146 sub-industries. In the final week of May, the traditionally defensive groups—such as consumer staples, health care and utilities—declined as much, if not more than, the overall market. This action implied that investors were retreating from stocks altogether, rather than just rotating into the safer havens.
While it was too soon to tell at the beginning of June if this pullback was going to morph into a correction (a decline of 10.0% to 19.9%) or worse, history reminded us that stocks have traditionally risen in June during these same strong-start years. So, what was an investor to do?
When in doubt, they could have always rebalanced their portfolio. But this begs another question. Which is the best frequency of portfolio rebalancing? Some suggest as often as quarterly, while others recommend following the four-year presidential cycle. Still others say, “let the portfolio tell you when it’s time,” meaning make adjustments only when the equity portion has deviated by more than 5% or 10% above or below its benchmark of 60% S&P 500 index and 40% Barclays Aggregate Bond Index.
Comparing Seven Strategies
Seven different rebalancing strategies were evaluated using a portfolio invested 60% in stocks as represented by the S&P 500 and 40% in bonds as represented by the Barclays Aggregate Bond Index.
Four approaches ranged in time:
-
quarterly rebalancing,
-
semiannual rebalancing—on April 30 and October 31 to coincide with the “Sell in May” strategy,
-
annual rebalancing and
-
rebalancing at the start of each four-year presidential election cycle.
Two more approaches looked for the misalignment of holdings to trigger a rebalancing event:
-
rebalancing when the stock portion rose above or below a 5% threshold and
-
rebalancing when the stock portion rose above or below a 10% threshold.
The final study looked at no rebalancing, taking a “just let it ride” approach.
What the Results Show
After evaluating the seven rebalancing strategies since 1976, the risk and return results continue to leave room for debate, but they did show three things: 1) a diversified portfolio obviously reduces monthly and annual volatility when compared with owning just stocks, 2) most rebalancing outcomes delivered similar risk and return results, but 3) the best risk-adjusted returns appeared to come from the more frequent rebalancing approaches.
Table 1 compares the return and risk results for the seven rebalancing strategies, plus the stock and bond benchmarks, over the last 43 years (through May 31, 2019) using month-end data. The compound annual growth rates (dividends included) ranged from 9.98% for the semiannual strategy to 10.17% for the +/–10% stock allocation approach. The best return, not surprisingly, came from the no-rebalancing strategy, which held the greatest proportion of equities. Indeed, the starting 60% exposure to the S&P 500 on December 31, 1975, grew to nearly 90% by the end of May 2019.
 But if Sir Isaac Newton had been an investor, his fourth law of motion may have been, “For every amount of return, there is an opposite, but similar, amount of risk.” And the same goes for rebalancing strategies. The greatest volatility, measured either in the deepest monthly decline or the highest 43-year standard deviation of annual returns, correlated highly with the greatest average exposure to equities—such as in the presidential election cycle, the +/–10% or the no-rebalancing approaches.
If you looked at the return-for-risk ratio (which divides the return by the volatility and indicates the dollar amount of return that was received for each $1 of risk accepted), you would be attracted to the higher numbers of 0.94 in Table 1, shared by the quarterly and annual rebalancing strategies. The least-attractive ratio came from the no-rebalancing approach, which delivered only 0.79.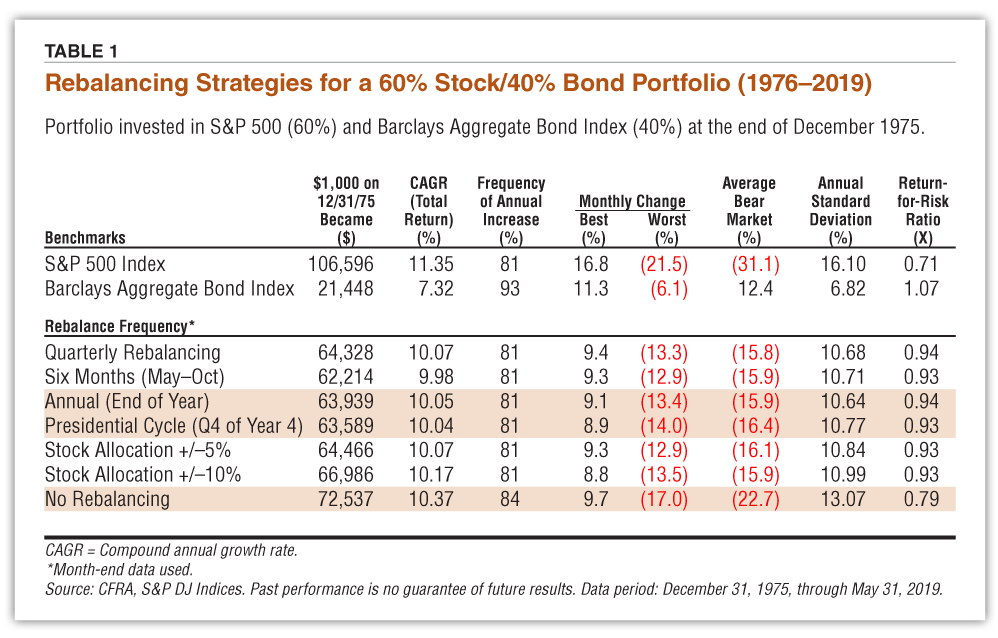
Conclusion
So, there you have it. The equity markets went through an adjustment period following its abnormally strong start to the year, triggered by global growth concerns related to the expanding trade war. Yet history offered a bit of optimism, as the S&P 500 rose in June during all five of the strongest-start years since 1945 and in 80% of the top 10 years, as compared with a normally unimpressive average return for stocks in June generally.
Short of bailing out of stocks altogether, balanced investors who wished to be proactive could have considered initiating a rebalancing strategy. Based on risk and return results since 1976, history says, but does not guarantee, that more frequent rebalancing—such as quarterly or annually—delivered more desirable results than longer time periods or adopting a “just let it ride” approach. Yet rebalancing, like everything else in investing, is highly personalized. That’s why the right answer to most financial questions continues to be “that depends.”
This article is reprinted from CFRA’s Sector Watch, U.S. Equity Research bulletin, June 3, 2019.

Related

Portfolio Strategies
Best Practices for Portfolio Rebalancing
Related
Portfolio Strategies
Ten Lessons You Should Learn From Recent Market History
Discussion
FREE REPORT

Get your free copy of our special
report analyzing the tech stocks
most likely to outperform the
market.
Milan Somborac from Ontario, Canada posted over 7 years ago:
PG from NY posted over 7 years ago:
Randall Knowles from MT posted over 7 years ago:
Chi-Town Rabble from CA posted over 7 years ago:
ADAM G from MA posted over 5 years ago:
THOMAS S from MN posted over 5 years ago:
You need to log in as a registered AAII user before commenting.
Log InCreate an account