

Related

Small Cap Value Investing
AAII’s screen based on the legendary Fidelity manager’s approach seeks firms with favorable “stories” and then determines a reasonable value at which to buy their stock.

Wayne Thorp leads a class in AAII's new Essential Investing Video Course. Go to https://www.aaii.com/ves for more information and to subscribe.
If you were to put together a list of the all-time-greatest investors, Peter Lynch definitely deserves to be at or near the top. The former manager of Fidelity’s Magellan Fund from 1977 to 1999 generated an average annual return of 29.2% during his tenure, outperforming the S&P 500 index in 11 of those 13 years. During that time, the assets under management (AUM) ballooned from $20 million to $14 billion.
Lynch has written three investing texts, including “One Up on Wall Street” (2nd edition, Simon & Schuster, 2000) and “Beating the Street” (revised edition, Simon & Schuster, 1994). He is credited with creating “growth-at-a-reasonable-price” investing, which combines the potential of growth investing with the discipline of value investing. As part of this, Lynch invented the price-to-earnings-growth (PEG) ratio, which helps investors determine whether a stock is inexpensive given its growth potential.
As a portfolio manager, Lynch was a bottom-up stock picker who looked for good companies selling at attractive prices. He did not focus on the direction of the market, the economy or interest rates. Instead, he felt it was better to spend your time looking for superior companies, doing fundamental research and keeping a close eye on the fundamentals of your holdings. Also, it is far better to do your own research, and ignore the hot tips.
The more familiar you are with a company, and the better you understand its business and competitive environment, the better your chances are of finding a good “story” that will come true. For this reason, Lynch is a strong advocate of investing in companies with which one is familiar, or whose products or services are relatively easy to understand.
Lynch does not believe in restricting investments to any one type of stock. His “story” approach suggests the opposite, with investments in firms with various reasons for favorable expectations. In general, however, he tended to favor small, moderately fast-growing companies that can be bought at a reasonable price.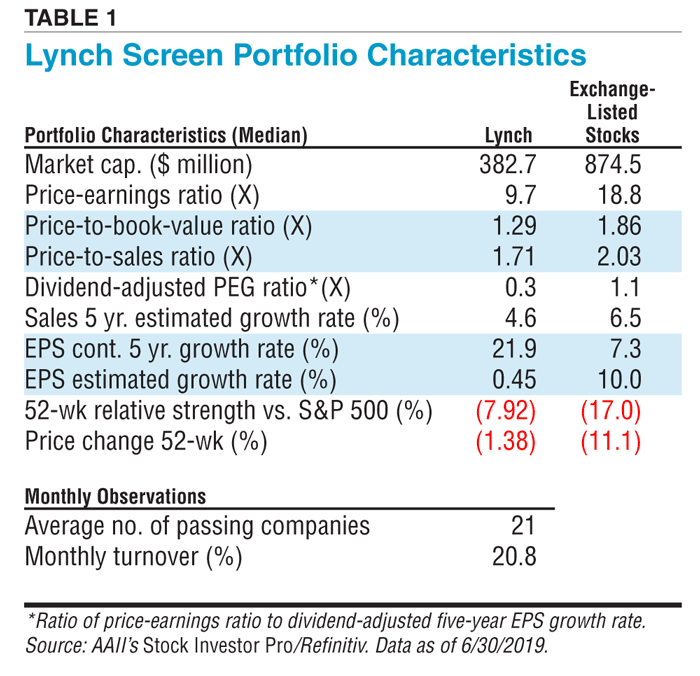
Lynch’s bottom-up approach means that prospective stocks must be picked one-by-one and then thoroughly investigated—there is no formula or screen that will produce a list of prospective “good stories.” The next step is to familiarize yourself thoroughly with the company so that you can form reasonable expectations concerning the future. However, Lynch does not believe that investors can predict actual growth rates, and he is skeptical of analysts’ earnings estimates.
Instead, he suggests that you examine the company’s plans—how does it intend to increase its earnings, and how are those intentions being fulfilled? Lynch points out five ways in which a company can increase earnings: It can reduce costs; raise prices; expand into new markets; sell more in old markets; or revitalize, close or sell a losing operation. The company’s plan to increase earnings and its ability to fulfill that plan are its “story,” and the more familiar you are with the firm or industry, the better edge you have in evaluating the company’s plan, abilities and any potential pitfalls.
Next, he suggests categorizing a company by “story” type, and he identifies six: slow-growers (large and aging; not Lynch’s favorites); stalwarts (large growth firms); fast-growers (small, aggressive firms; among his favorites); cyclicals (require close watch); turnarounds (can move back up quickly); asset opportunities (overlooked by analysts).
Analysis is central to Lynch’s approach. In examining a company, he is seeking to understand the firm’s business and prospects, including any competitive advantages, and evaluate any potential pitfalls that may prevent the favorable “story” from occurring. Also, an investor cannot make a profit if the stock was purchased at a too-high price. For that reason, he also seeks to determine reasonable value. Here are some of the key numbers Lynch suggests investors examine:
Sustainable Earnings Growth
The growth rate of earnings should fit with the firm’s “story”—fast-growers should have higher growth rates than slow-growers. Extremely high levels of earnings growth rates are not sustainable but continued high growth may be factored into the price. A high level of growth for a company and industry will attract a great deal of attention from both investors, who bid up the stock price, and competitors, who provide a more difficult business environment.
Lynch prefers to invest in companies with earnings expanding at moderately fast rates (20% to 25%) in non-growth industries. To avoid companies whose earnings growth is not sustainable in the longer term, AAII’s Lynch strategy excludes companies whose average annual growth rate in earnings per share over the last five years is greater than 50%.
Price-Earnings Ratio
The earnings potential of a company is a primary determinant of company value. At times, the market may get ahead of itself and even overprice a stock with great prospects. The price-earnings ratio helps to keep your perspective in check. The ratio compares the current price to the most recently reported earnings. Stocks with good prospects should sell with higher price-earnings ratios than stocks with poor prospects.
By studying the pattern of price-earnings ratios over several years, you can develop a sense of the normal level for the company. This knowledge should help you avoid buying into a stock if the price gets ahead of the earnings or send you an early warning that it may be time to take some profits in a stock you own. If a company does everything well, you may not make any money on the stock if you paid too much for it.
The AAII Lynch approach specifies that the company’s current price-earnings ratio be lower than its own five-year average price-earnings ratio. Implicit in this filter is that a company must have five years of positive earnings and five years of price data.
Comparing a company’s price-earnings ratio to the industry may help reveal whether the company is a bargain. At a minimum, it leads to questions as to why the company is priced differently. Lynch’s ideal investment is a neglected niche company—one that controls a market segment in an unglamorous industry in which it would be difficult and time-consuming for another company to compete. The AAII Lynch screen requires that the company have a price-earnings ratio lower than the median for its respective industry.
Also, the AAII Lynch screen excludes firms in the financial sector because their financial statements cannot be directly compared to other firms.
Growth at a Reasonable Price
Companies with better prospects should sell with higher price-earnings ratios. A useful valuation technique is to compare the price-earnings ratio to the earnings growth, called the PEG ratio. A price-earnings ratio of half the level of historical earnings growth is considered attractive, while ratios above two are considered unattractive.
Lynch refines this measure by adding the dividend yield to earnings growth. This adjustment acknowledges the contribution that dividends make to an investor’s return. The ratio is calculated by dividing the price-earnings ratio by the sum of the earnings growth rate and the dividend yield. With this modified technique, ratios above 1.0 are considered poor, while ratios below 0.5 are considered attractive. The AAII Lynch screen uses this dividend-adjusted PEG ratio, with a ratio less than or equal to 0.50 specified as a cut-off.
Strong Balance Sheet
A strong balance sheet provides maneuvering room as the company expands or experiences trouble. Lynch is especially wary of bank debt, which can usually be called in by the bank on demand. Small-cap stocks have a more difficult time raising capital through the bond market than larger stocks and often turn to banks for capital. A close examination of the financial statements, especially in the notes to the financial statement, should help to reveal the use of bank debt.
The AAII Lynch approach makes sure that the company’s ratio of total liabilities to assets is below its industry norm. The screen uses total liabilities because it considers all forms of debt. It compares the company’s ratio against industry levels because acceptable levels vary from industry to industry. Normal debt levels are higher for industries with high capital requirements and relatively stable earnings such as utilities.
Institutional Ownership
Lynch feels that the bargains are located among the stocks neglected by Wall Street. The lower the percentage of shares held by institutions and the lower the number of analysts following the stock, the better. The AAII Lynch strategy requires a lower percentage of shares held by institutions than the median of all U.S.-listed stocks.
Once you have filtered down the stock universe and begin evaluating individual companies, there are certain characteristics that Lynch finds particularly favorable. These include:
Characteristics Lynch finds unfavorable are:

Lynch says investors should buy as many “exciting prospects” that they can uncover that pass all the tests of research. However, there is no point in diversifying just for the sake of diversifying. Lynch suggests investing in several categories of stocks as a way of spreading the downside risk.
Although Lynch is an advocate of maintaining a long-term commitment to the stock market, he says investors should review their holdings every few months, rechecking the company “story” to see if anything has changed either with the unfolding of the story or with the share price. The key to knowing when to sell, he says, is knowing “why you bought it in the first place.” Lynch says investors should sell if:
For Lynch, a price drop is an opportunity to buy more of a good prospect at cheaper prices. It is much harder, he says, to stick with a winning stock once the price goes up, particularly with fast-growers where the tendency is to sell too soon rather than too late. With these firms, he suggests holding on until it is clear that the firm is entering a different growth stage.
Rather than simply selling a stock, Lynch suggests “rotation”—selling the company and replacing it with another company with a similar story, but better prospects. The rotation approach maintains the investor’s long-term commitment to the stock market and keeps the focus on fundamental value.
AAII has been developing, testing and refining a wide range of screening strategies over the years. Many of the screens follow the approaches of popular investment professionals, while others are tied to basic principles of investing. These approaches run the full spectrum, from those that are value-based to those that focus primarily on growth, while most fall somewhere in the middle.
Screens following the approach of an investment professional do not represent their actual stock picks. The rules of each screen are defined by our interpretations of their respective investment approaches. The criteria for each screen are programmed into the Stock Investor Pro program and are also posted in the Stock Ideas area of AAII.com.
Each month, 60 separate screens are performed using AAII’s Stock Investor Pro and the current companies passing each screen are reported. Stock Investor Pro subscribers can access daily results online or run the screens themselves on a daily basis
AAII members can access the screening strategies by going to the Stock Ideas area of AAII.com (www.aaii.com/stockideas). Featured strategies are rotated on Stock Ideas on the 15th of each month (excluding holidays and weekends). The top five passing companies for each featured strategy are shown, results are updated daily and tickers are linked to in-depth data. The AAII Stock Ideas Update email will notify you when the strategies have been updated on AAII.com and provide a more in-depth look at a featured screen each month. You can sign up for this complimentary newsletter at www.aaii.com/email.
The performance of the stocks passing each screen is tracked on a monthly basis and reported at the Stock Ideas area. The month-to-month closing price is used to calculate the return, with equal investments in each stock at the beginning of each month assumed. The impact of factors such as commissions, bid/ask spreads, time slippage (the time between the initial decision to buy a stock and the actual purchase) and taxes is not considered. This overstates the reported performance, but all approaches are subject to the same conditions and procedures. Higher turnover portfolios typically benefit more from these simplified rules.
Keep in mind, however, that performance figures for the AAII stock screening strategies represent price change only, and do not include dividend payments or dividend reinvestment. Therefore, the results of screens that tend to isolate large, dividend-paying stocks—such as the Dogs of the Dow (in the value category)—do not receive a boost from dividend payments or reinvestment.
Sell rules are the same as the buy rules: The hypothetical portfolios are completely reallocated using each subsequent month’s data. Thus, a stock is sold (no longer included in the portfolio) if it ceases to meet the initial criteria, and new stocks are added if they qualify. Note that we use these rules for backtesting purposes but do not necessarily advocate them as part of a real-world investment framework.
Stocks that no longer qualify are dropped even if the strategist behind a particular approach suggests different sell rules versus buy rules. This may shorten the holding period and increase the turnover relative to what the strategist would suggest for an actual portfolio.
Small Cap Value Investing

Financial Statements

Stock Strategies

Dave G. from WA posted over 7 years ago:
Geoff from CA posted over 6 years ago:
You need to log in as a registered AAII user before commenting.
Log InCreate an account