


This “Throwback Thursday” article comes from AAII’s extensive archives spanning four decades. While these articles may have been written long ago, the investment topics they cover are just as relevant today as they were when they were written. We are pleased to reintroduce them to a new audience.
Timing may not be everything, but it is a major preoccupation for many an investor. A recent article in the “Investor workshop” [February 1986] focused on the range and average of dividend yield on the market to indicate whether stocks appeared to be relatively overvalued, undervalued or fairly valued based on historical averages.
Another broad timing approach that also uses dividend yield is the spread between bond yields and common stock yields.
What are these yields? The bond yield may be calculated by dividing the annual interest payment on the bond by the bond’s price. This is also known as the current yield, and is the yield quoted for corporate bonds in The Wall Street Journal. The bond yield used in the indicator can also be the yield-to-maturity, which takes into consideration the interest payments on the bond, the current price of the bond and the maturity value of the bond.
Dividend yield on a common stock is much like the current yield on a bond—it is the annual cash dividend divided by the market price of the common stock.
It should be remembered that neither the current yield on the bond nor the stock dividend yield represents total return for an investment, because the yields do not consider price changes over investment holding periods. They are point-in-time yields. The yield-to-maturity of a bond, however, does consider total return.
The Timing Rationale
Why look at the bond-stock yield spread?
All investments are competitive on a risk and return basis. Bonds are alternative investments to common stocks. While inherent risk characteristics are important, higher anticipated yields or returns will attract investors to the higher-yielding investment. Looking at yields in isolation gives no basis of comparison with alternative investments. However, bond-stock yield spreads for composite bond and stock markets provide a relative measure of the attractiveness of the bond and stock markets.
What information does the bond-stock yield spread convey? Obviously, you must look at the components first.
On the bond side, low bond yields indicate that market interest rates are low, a situation favoring common stock investment. High bond yields would normally attract investment funds to the bond market. How high is high, and how low is low? A comparison to stocks is necessary.
On the stock side, a historically low dividend yield on common stocks implies that common stock prices are relatively high—in other words, the market value of common stocks are high relative to the cash dividend; investors would not be attracted. On the other hand, a historically high dividend yield implies relatively low values for common stocks, attracting investors. Cash dividends are relatively slow to change, but common stock prices are volatile, lending the dividend yield some value as a timing variable.
Putting both of the yields together in a bond-stock yield spread format combines the two variables into a relative measure. Bond yields have been higher than stock yields during modern financial times. A historically low bond-stock yield spread would imply some combination of low bond yields and high common stock dividend yields, a market environment that would favor rising common stock prices.
Conversely, a historically high bond-stock yield spread would imply some combination of high bond yields and low dividend yields—a market environment favorable to bonds and unfavorable to common stocks.
Of course, in addition to the importance of the bond-stock yield spread, the level and trend of the spread is significant. In fact, the start of the most recent bull market occurred when the bond-stock yield spread was historically quite high. The trend, however, was heading down.
A number of investment publications cover the yield spread—it is a widely followed indicator. However, some analysts and sources compute it in a fashion opposite of what we have done here: They compute a stock-bond spread. Since dividend yields are less than bond yields, this produces a negative spread, which means a slightly different interpretation is in order. For instance, the market laboratory page in Barron’s gives the dividend yield on the Dow Jones industrial average, the yield on best-grade corporate bonds and the stock-bond yield gap. For a recent period, this was:
| DJIA yield | Best-grade bond yield | Yield gap |
|---|---|---|
| 2.19% | 3.29% | –1.10% |
The interpretation of the yield gap of –1.10% is that the larger the negative yield gap, the worse the market environment for common stocks; the smaller the negative yield gap, the more conducive the market environment for common stocks.
A Look at the Spreads
Figure 1 contains two graphs. The upper graph displays the bond yield and stock dividend yield monthly since the beginning of 1976. This provides some idea of what the components of the indicator have been doing. The bond yields are yields-to-maturity for high quality (low default risk) long-term corporate bonds, and the dividend yield is the yield for the S&P 500 index. [In the February article on dividend yield, we used the dividend yield for the Dow Jones industrials; due to the differences between the 30 industrials and the S&P 500, the results are somewhat different.]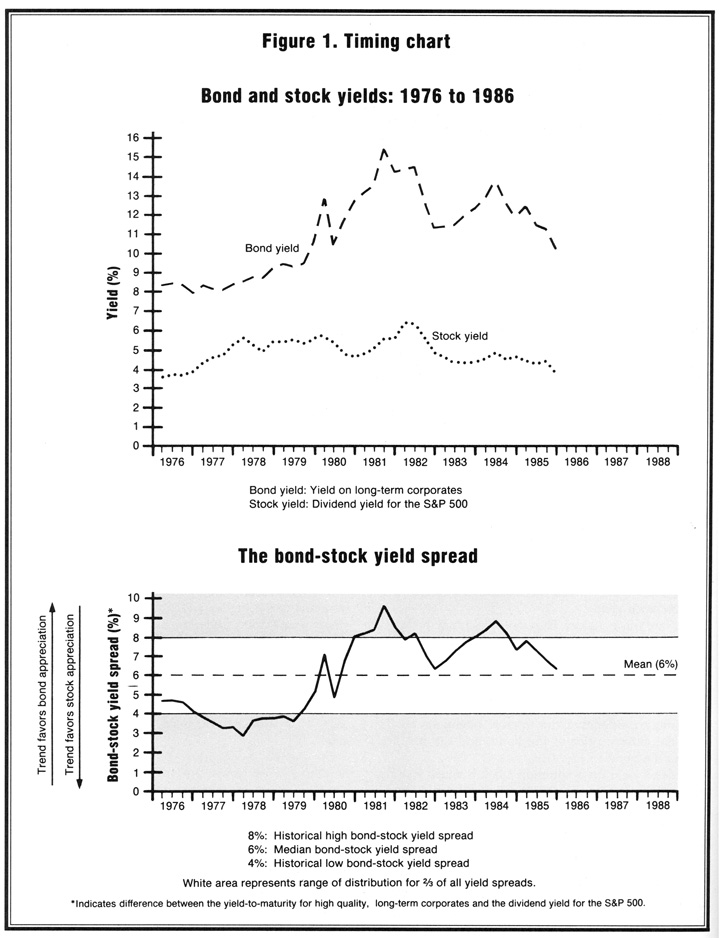
The lower graph displays the spread (difference) between the two yields. It also notes the average spread for the period, and provides an indication of the range—high and low—that historically has encompassed two-thirds of all yield spreads.
As a broad market timing approach, spreads above the range favor bond appreciation and spreads below the range favor common stock appreciation. The graph also illustrates the importance of a change in trend, which occurred in mid-1982 and again in 1985, when the yield spread was high but declined abruptly.
Currently, the indicator suggests a continuation of the favorable outlook for stocks. However, as with many indicators, one of the factors that causes the yield spread to change is the market itself, making it less effective as an indicator of what the market will be doing, and making it more of an indicator of what the market is currently doing.
This article was written by John Markese for the April 1986 issue of the AAII Journal. At the time, he was director of research at AAII. He is also a former president of AAII and currently serves as vice chairman.
Discussion
FREE REPORT

Chuck from Georgia posted over 7 years ago:
You need to log in as a registered AAII user before commenting.
Log InCreate an account