


An analysis by S&P Global Ratings found that companies overestimate the level of growth in EBITDA (earnings before interest, tax, depreciation and amortization) and reduction in debt following a merger (M&A) or leveraged buyout (LBO). The authors found the actual post-transaction changes to be “materially short of issuer projections for the two years that we tracked companies’ performance after transaction origination.”
The authors further cited what they described as “a clear bias to overestimate EBITDA in management projections.” The average earnings miss was 35% for years one and two. By the end of the second year, 55% of analyzed companies missed their EBITDA target by at least 25%.
On the debt side, nearly all companies project plans to reduce debt (deleverage) at a merger or leverage buyout’s inception. While about two-thirds of companies kept their debt levels roughly in line with expectations during the first year after a deal was completed, just 48% did during the second year. Even using surplus cash to pay down debt appeared to be “infrequently executed.”
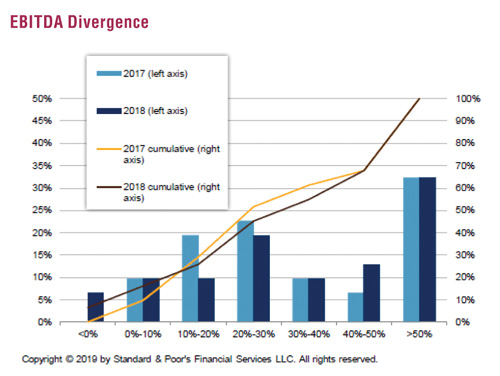
EBITDA itself is a proxy for cash flow and can be reported on an adjusted basis. Among the companies analyzed, add-backs of transaction costs, current expenses and anticipated cost savings (aka synergies) have composed about half of trailing 12-month adjusted EBITDA figures over the last four years. Synergies and cost-savings have been the largest component of those add-backs. S&P Global Ratings rarely includes the full amount companies project for these items because they are difficult to accurately predict.
The highest level of add-back-inflated EBITDA was found among companies operating in the media/entertainment/leisure, technology and health care sectors. Aerospace, forest products and business and consumer companies had below-average levels of add-backs.
The analysis of changes in EBITDA growth and leverage used a sample of large M&A and leveraged buyout transactions that originated in 2015 and 2016. The analysis on EBITDA add-backs encompassed 258 M&A and LBO transactions occurring between 2015 and 2018. All of these transactions had a deal size of greater than $50 million.
Source: “When the Cycle Turns: The Continued Attack of the EBITDA Add-Back,” by Olen Honeyman, Hanna Zhang, Tejaswini Tungare and Ramki Muthukrishnan; SPGLOBAL, September 19, 2019.



Discussion
FREE REPORT

Get your free copy of our special
report analyzing the tech stocks
most likely to outperform the
market.
No comments have been added yet. Add your thoughts to the discussion!
You need to log in as a registered AAII user before commenting.
Log InCreate an account