
A Simple Method for Comparing Mutual Funds

Rather than looking at returns for the most recent year, consider a variety of factors when attempting to choose between two or more funds. This kind of comparison can simplify your choice.

Featured Tickers:

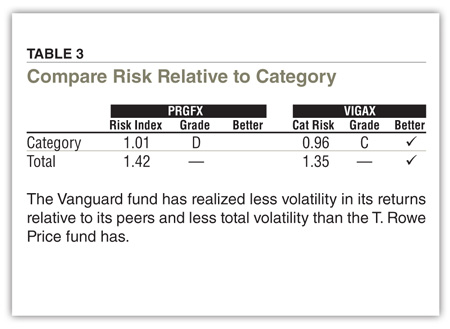
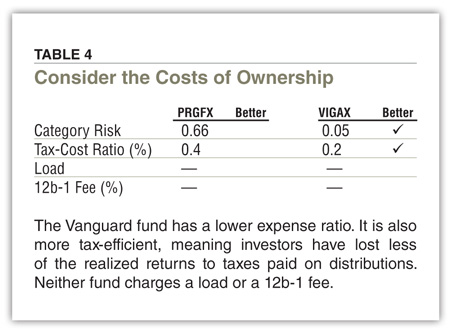
Rather than looking at returns for the most recent year, consider a variety of factors when attempting to choose between two or more funds. These factors include calendar returns, annualized returns over different periods, risk and costs. This comparison will often simplify the choice.

The below example compares two large-growth funds, T. Rowe Price Growth Stock (PRGFX) and Vanguard Growth Index Admiral (VIGAX). The example is not intended to recommend either fund but rather to demonstrate the process for comparing. In cases when a clear choice does not emerge, other factors may need to be taken into consideration such as yield, manager tenure for actively managed funds and R-squared.
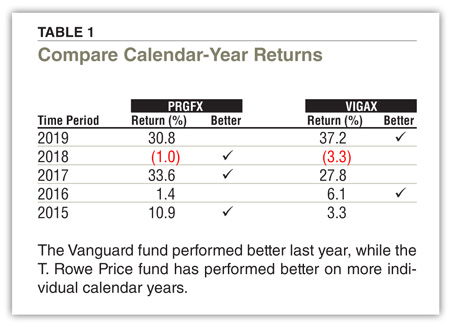
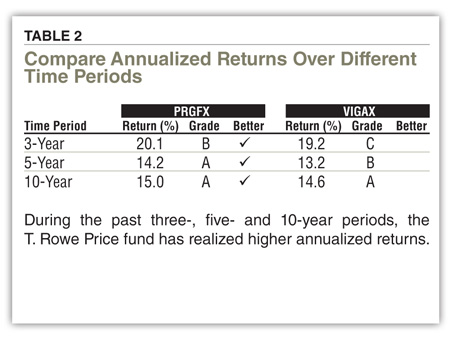


Sources: AAII and Morningstar Inc. Data as of December 31, 2019.

Discussion

Chuck Knock from Michigan posted over 6 years ago:

Thank you for this opportunity. I have been invested for years in Franklin Income Fund A, and when I looked it up on your fund evaluator it rated F's across the board. Much to my surprise. Does anyone know of any income funds with higher grades? Thanks for your help.


Bruce from Washington posted over 6 years ago:

Thanks for putting together such a simple and effective comparison tool. Any chance that you have the fund comparison tables in an Excel spreadsheet?


Gary from California posted over 6 years ago:

Your mutual fund guide shows far higher returns for Vanguard Growth Index Admiral (VIGAX) than the Vanguard website itself. You list 3 yr 19.2, 5 yr 13.2, 10 yr 14.6' while Vanguard reports 3 yr 10.09 , 5 yr 9.16, 10 yr 12.37' Why such a large disparity ?


Andy from NV posted over 6 years ago:

My guess would be that the date ranges covered are not the same and that Vanguard's site reflects the recent downturn. You'd probably see April '17 through March '20 if you looked at Vanguard's site right now. Yep. The article is looking at Jan '17 to Dec '19 as its 3 year period. 10.09% is thru Mar. 30th.


THOMAS R from FL posted over 5 years ago:

Trading off risk vs Return can become more qualitative than quantitative. I've been looking for a way to plot performance on a Capital Market Line to more effectively display performance. Challenge seems to be converting risk back to a Standard Deviation. MorningStar and the others seem to omit SD when showing 1, 3, 5 year performance... Could this type of analysis and simple display on CML be adapted to A+ as background program doing the number crunching? Thanks, Tom R Jacksonville Beach


You need to log in as a registered AAII user before commenting.
Create an account

Log In

Get your free copy of our special report analyzing the tech stocks most likely to outperform the market.

Download the FREE Report Here: