

Related

Dispatches
Looking at the ratio of retained earnings to book value to screen for undervalued stocks.
Charles Rotblut leads a class in AAII's new Essential Investing Video Course. Go to https://www.aaii.com/ves for more information and to subscribe.
In the Dispatches section of the January 2020 AAII Journal, we discussed a study promoting the use of the retained earnings-to-market capitalization (RE/M) ratio (“Retained Earnings Is More Predictive Than Book Value”). The authors of the study believe this ratio is a better measure to identify value stocks with potential upside than the traditional book-to-market ratio (B/M). The book-to-market ratio is the inverse of the price-to-book ratio.
Since retained earnings include past earnings and average one-time items and other inconsistencies, they are essentially immune to individual year accounting effects, according to the study’s authors. The authors further claimed that retained earnings have more predictive power about which stocks were likely to outperform during the period of 1990 through 2017.
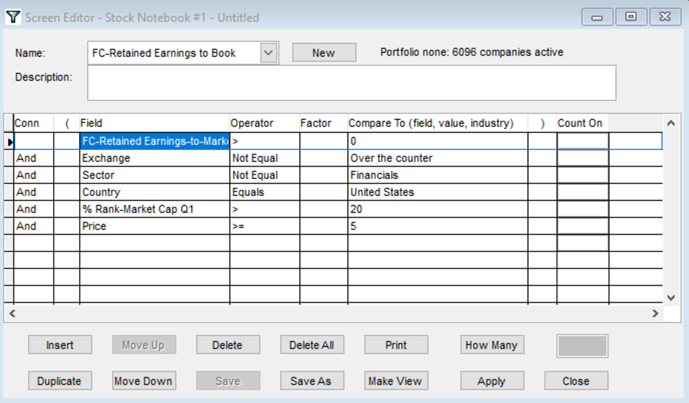
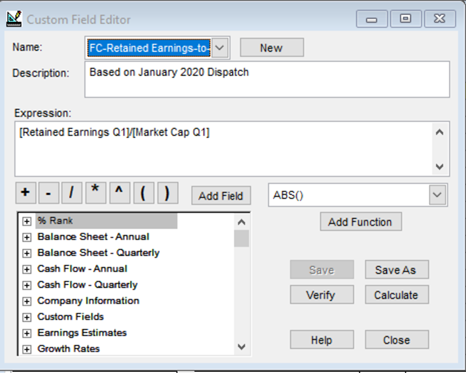
This month’s First Cut takes their research and applies it to a stock screen. We calculated the ratio of retained earnings to book value for exchange-listed companies by using the most recently reported quarterly data and creating a custom field in AAII’s Stock Investor Pro.

Following the study’s lead, financial stocks were excluded, as were micro-cap stocks. (Micro-cap stocks were defined as having market capitalizations ranking in the smallest 20%.) Foreign stocks were excluded to avoid any issues relating to differences in accounting standards. A minimum share price of $5 was required to exclude those stocks at greater risk of being delisted.
The resulting list of passing companies was then sorted based on their retained earnings-to-market ratios. The 20 companies with the highest retained earnings-to-market ratios are shown below. The table displays the price-to-book ratio to provide a comparison and to give an indication of how each stock’s valuation ranks on a more traditional indicator. Since the retained earnings-to-market ratio was described as a “predictor of earnings growth,” the table also shows earnings for the most recently reported fiscal year and projected earnings for the following fiscal year.
Dispatches


No comments have been added yet. Add your thoughts to the discussion!
You need to log in as a registered AAII user before commenting.
Log InCreate an account