

Related

Stock Strategies
Graham recommended that a stock be purchased only if the price was two-thirds or less of net current assets.
by John Bajkowski | May 2020

Benjamin Graham observed that the clear-cut undervaluation of companies typically only occurs during bear markets. His most basic approach looked for stocks trading with a low price relative to net current assets.
The price-to-net-current-assets ratio compares the current market price of a stock to the current assets less all debt, both short- and long-term including preferred stock. Current assets consist primarily of cash and cash equivalents, receivables and inventories. These are assets that are already cash or are convertible into cash in a relatively short period (usually less than a year). Net current assets exclude not only the intangible assets but also the fixed and miscellaneous assets of a firm. Graham recommended that a stock be purchased only if the price was two-thirds or less of net current assets. However, even during our bear market today, it is rare to find a stock selling below two-thirds of its current net assets unless they are in financial trouble.
This First Cut for stocks simply screens for domestic, exchange-listed stocks with a low ratio of price to net current assets. Stocks in the financial sector were excluded because their financial statements are not directly comparable to other industries. To help eliminate firms in financial trouble, positive earnings per share was required, along with positive cash flow from operations for the most recent fiscal year and the last four quarters, as well as positive projected earnings for this year and next. Stocks were also required to have debt levels below their industry norm as a simple first test for financial strength.
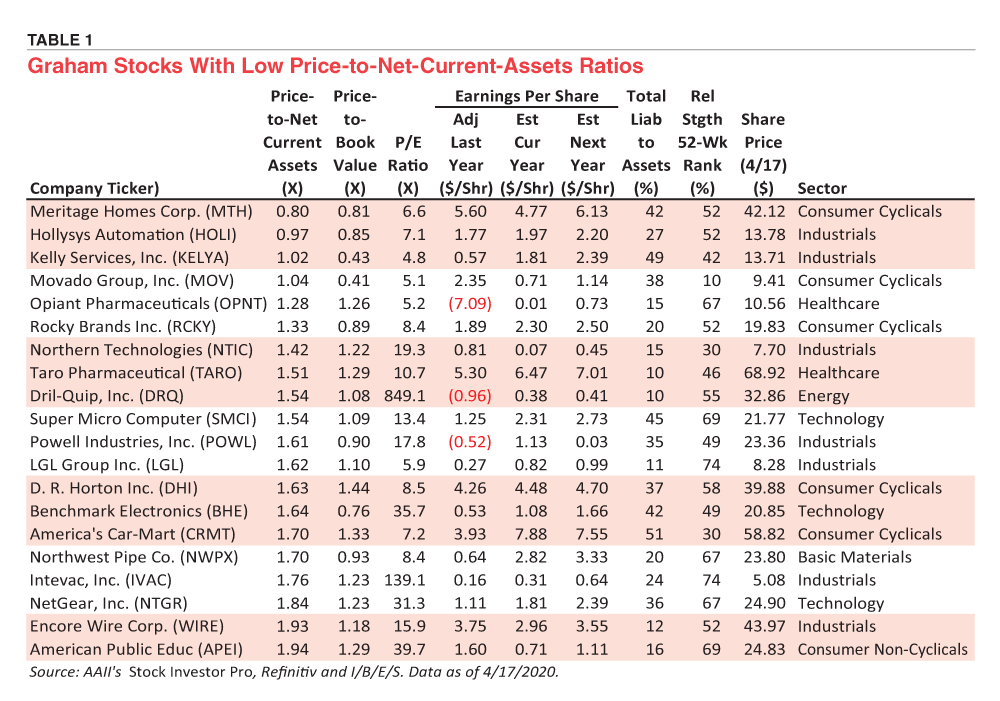
The 20 stocks with the lowest price-to-net-current-assets ratio are presented below. Additional popular price multiples are presented to provide a feel for how these stocks measure up using book value and earnings. The 52-week weighted relative strength rank highlights the performance of these stocks, with greater weight given to the last quarter. ▪

Net Current Assets Q1:
(IIF([Current assets Q1]=0,([Cash Q1]+[Short-term investments Q1]+[Accounts receivable Q1]+[Inventory Q1]+[Other current assets Q1]),[Current assets Q1]))+IIF(IsFieldNull([Long-term investments Q1])=0,0,[Long-term investments Q1])-[Total liabilities Q1]-[Preferred stock Q1]
Price to Net Current Assets:
[Market Cap Q1]/[Net Current Assets Q1]
Stock Strategies

AAII Stock Ideas

Financial Statements

Earl Ferguson from GA posted over 6 years ago:
Earl Ferguson from GA posted over 6 years ago:
You need to log in as a registered AAII user before commenting.
Log InCreate an account