


Related

First Cut Stocks
One of the lesser-known measures that helps determine the financial strength of a company is the interest coverage ratio.

Derek Hageman leads a class in AAII's new Essential Investing Video Course. Go to https://www.aaii.com/ves for more information and to subscribe.
The coronavirus pandemic forced a number of companies to skip interest payments and announce dividend suspensions and cuts and, in more dire cases, drove many struggling companies over the edge and into bankruptcy.
Companies are facing numerous challenges, including slumping sales and large debt loads. Economic uncertainty, lockdown measures and stay-at-home orders forced many nonessential businesses to close and weakened demand for all types of goods and services overnight. Companies that headed into this downturn without a financial cushion are already feeling the pain from the slowdown.
According to S&P Global, 266 publicly traded U.S. companies had suspended or reduced their dividends in May 2020. The number of bankruptcy filings has risen sharply as well, with little revenue coming in, according to data from the American Bankruptcy Institute. The group reported 560 commercial Chapter 11 filings in April 2020, a 26% increase from last year.
The slowdown has hit some industries harder than others, including companies belonging to struggling industries like airlines, energy, hospitality and retail. It is likely that more companies will assess their dividends as the third quarter of 2020 progresses, while others will file for bankruptcy.
Of course, there’s no way to predict for certain which companies will miss interest payments, or to know which companies may adapt their dividend policies, but there are a few coverage ratio measures that may shed some light.
A coverage ratio is one of a group of measures on a company’s ability to service its debt and meet its financial obligations such as making interest payments and/or paying dividends. The higher the coverage ratio, the easier it should be to make interest payments on debt or pay dividends. If a coverage ratio is low or trending downward, it may signal trouble. There are several coverage ratio measures that can be used to help identify companies in a potentially troubled financial situation.
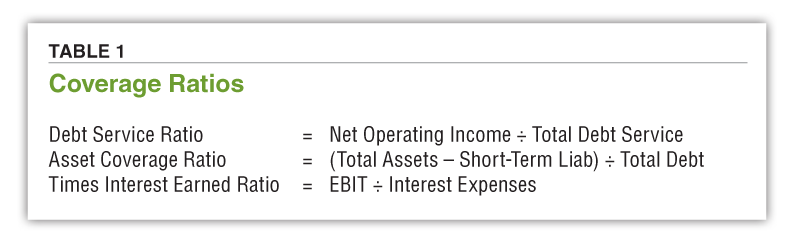
Two of the more common coverage ratios are the debt service ratio and the asset coverage ratio. The debt service coverage ratio measures how well a company can pay its entire debt service (principal and interest payments) from earnings. The ratio is commonly calculated by dividing a company’s net operating income by its total debt service for the same period. A ratio of one or above is indicative of a company that generates sufficient earnings to completely cover its debt obligations.
The asset coverage ratio is similar in nature to the debt service coverage ratio but examines balance sheet assets instead of comparing income to debt levels. The ratio is calculated by dividing total assets less short-term liabilities by total debt for the same period.
Using a combination of coverage ratio measures is helpful when analyzing a company’s debt obligations. Many factors go into determining these ratios, and a more in-depth assessment of a company’s financial statements is often suggested to determine a company’s health.
One of the lesser-known measures that helps determine the financial strength of a company is the interest coverage ratio. Analyzing a company’s interest coverage ratio is one of the tools investors can use to determine a company’s ability to pay its obligations and evaluate the safety of a company’s dividend.
The interest coverage ratio, sometimes referred to as “times interest earned,” determines how easily a (nonfinancial) company can pay its interest expenses on outstanding debt with operating earnings. The ratio is most commonly calculated by dividing a company’s earnings before interest and taxes (EBIT) by its interest expenses for the same period.
The larger and more stable the ratio, the lower the risk of the company defaulting. In addition, the higher the ratio, the more flexibility a company has to meet its financial obligations and have money left over for dividends, expansion, etc.
Interest on debt obligations must be paid, regardless of a company’s future potential. Failure to do so will result in default if the lender is not willing to restructure debt obligations.
As the interest coverage ratio falls, the risk of a company defaulting on its debt obligations increases. A ratio of less than 1.0 indicates that a company’s current earnings are not high enough to meet its current debt obligations, which means it will need to liquidate assets to make up the shortfall or find additional funding. This has an important implication for dividends, since bondholders will be paid before dividends are paid. If a company can’t meet its debt obligations, it’s fair to say that the company won’t be able to pay its dividend.
Let’s take a closer look at three examples to determine how easily the companies can pay their interest expense on outstanding debt with operating earnings. To provide some context, a few of the companies will be compared to their respective current industry interest coverage ratio median.
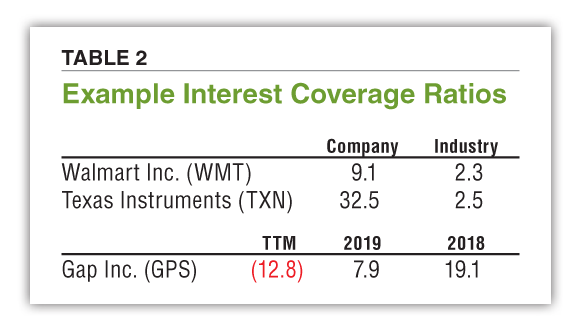
The largest retailer in the world, Walmart Inc.  (WMT) operates a chain of more than 11,000 discount department stores, wholesale clubs, supermarkets and supercenters, can cover its interest expense on outstanding debt with operating earnings by 9.1 (EBIT of $22,873 million ÷ interest expense of $2,518 million) compared to the food & distribution retailers industry median of 2.3. Texas Instruments (TXN)—one of the world’s largest semiconductor manufacturers, with a focus on analog and embedded processing products—has a times interest earned ratio of 32.5 (EBIT of $5,752 million ÷ interest expense of $177 million) compared to the semiconductors industry median of 2.5.
As measured by the times interest earned ratio, Walmart and Texas Instruments are financially strong, with low credit risk and low probability of a dividend cut or suspension.
A deteriorating interest coverage ratio may signal trouble. With the severity of the coronavirus pandemic’s impact on businesses, and the uncertainty of when the economy will rebound, companies need to take steps to weather a potentially prolonged recovery. Companies may have little choice but to scale down operations to preserve cash and sell assets to pay down debt.
Gap Inc. (GPS) is a retailer that offers casual apparel and accessories under the Old Navy, Gap, Banana Republic and Athleta brands. The company’s interest coverage ratio has declined over the last few years from 19.1 in fiscal-year 2018, to 7.9 last year, to a negative ratio of 12.8 (EBIT of –$958 million ÷ interest expense of $75 million) for the most recent four quarters ending May 2, 2020.
Gap has deteriorating fundamentals highlighted by slumping comparable-store sales, waning free cash flow and eroding margins. With only 55% of its stores reopened as of June 4, 2020, due to coronavirus disruptions, Gap suspended its share repurchases and announced a dividend suspension for the rest of fiscal 2020 in an effort to conserve cash. Gap paid out $200 million for share repurchases and $364 million in dividends in 2019. These suspensions, then, theoretically save it $564 million in cash over the next 12 months. Gap also plans to cut 2020 capital expenses by $300 million while also reducing operating expenses where possible.
In addition to suspending share buybacks and cutting or eliminating the dividend, there are several actions that companies can take to increase financial flexibility. These include but are not limited to reducing labor and operating costs, cutting executive salaries, lowering capital expenditures and drawing down revolving credit lines.
In this illustration, only the interest coverage ratio was used, but it is usually combined with other measures such as the debt service and asset coverage ratios and the ratio of total liabilities to total assets to get a more complete understanding of a company’s financial leverage. Many factors go into determining these ratios and a deeper dive into a company’s financial statements is often suggested to ascertain a company’s total financial health. ▪
First Cut Stocks

Financial Statements

Computerized Investing

BRENT T from TX posted over 6 years ago:
You need to log in as a registered AAII user before commenting.
Log InCreate an account