


Related

From the Archives
Although index mutual funds and ETFs seek to mimic the composition and performance of an index, they are usually not exact copies of the index itself.

Wayne Thorp leads a class in AAII's new Essential Investing Video Course. Go to https://www.aaii.com/ves for more information and to subscribe.
If you have been shopping for index funds, have you ever run across those that track the same index but have different (in some cases, very different) returns?
An index fund is a collection of stocks, bonds or other securities that tracks a market index—a group of securities that’s used to represent a segment of the market. A stock index fund, for example, owns shares of the constituent stocks that make up the index that it tracks, and fund investors own a proportional stake in all of those stocks.
There are thousands of index funds, and they vary greatly according to the indexes they track. Index funds are available for a wide range of investments beyond stocks, including bonds, commodities and real estate investments. Some stock index funds own just a small number of stocks, while others own thousands of different stocks. Regardless of the index they track, the primary objective of an index fund is to match the performance of the underlying index.
The amount of money in passive U.S. stock funds exceeded that in actively managed holdings for the first time in August 2019, according to data from Morningstar at the time. There were $4.271 trillion assets under management in passive U.S. equity funds—index exchange-traded funds (ETFs) and mutual funds—overtaking the $4.246 trillion in actively managed funds—mostly mutual funds—as of August 31, 2019, Morningstar reported.
It’s worth pointing out, however, that not all index mutual funds and ETFs are created equal. In fact, there are a number of factors that can lead some mutual funds or ETFs to track their indexes more closely than others.
Although index mutual funds and ETFs seek to mimic the composition and performance of an index, they are usually not exact copies of the index itself. Keep in mind that an index is merely a group of the securities’ prices run through a mathematical formula to arrive at a measure of the group’s performance.
But running an index mutual fund or ETF still costs money. The fund company must pay a manager to buy and sell the securities in that index, as well as the administrative expenses of record-keeping, customer service, etc. These costs are passed along by index funds and ETFs to their customers in the form of fees, some of which are explicitly stated in the fund’s expense ratio while others are less transparent, such as brokerage costs. Funds’ construction methods along with practices such as securities lending can also have an impact on index-fund investors’ take-home returns.
There are currently 33 “investor class” mutual funds (funds available for purchase by individual investors) in the AAII mutual fund universe that track the S&P 500 total return index, excluding those that are closed to new investors (there is currently only one mutual fund in the AAII mutual fund database tracking the S&P 500 total return index that is closed to new investors). This list also does not include the three mutual funds in the AAII fund database that track the equal-weighted S&P 500 index.
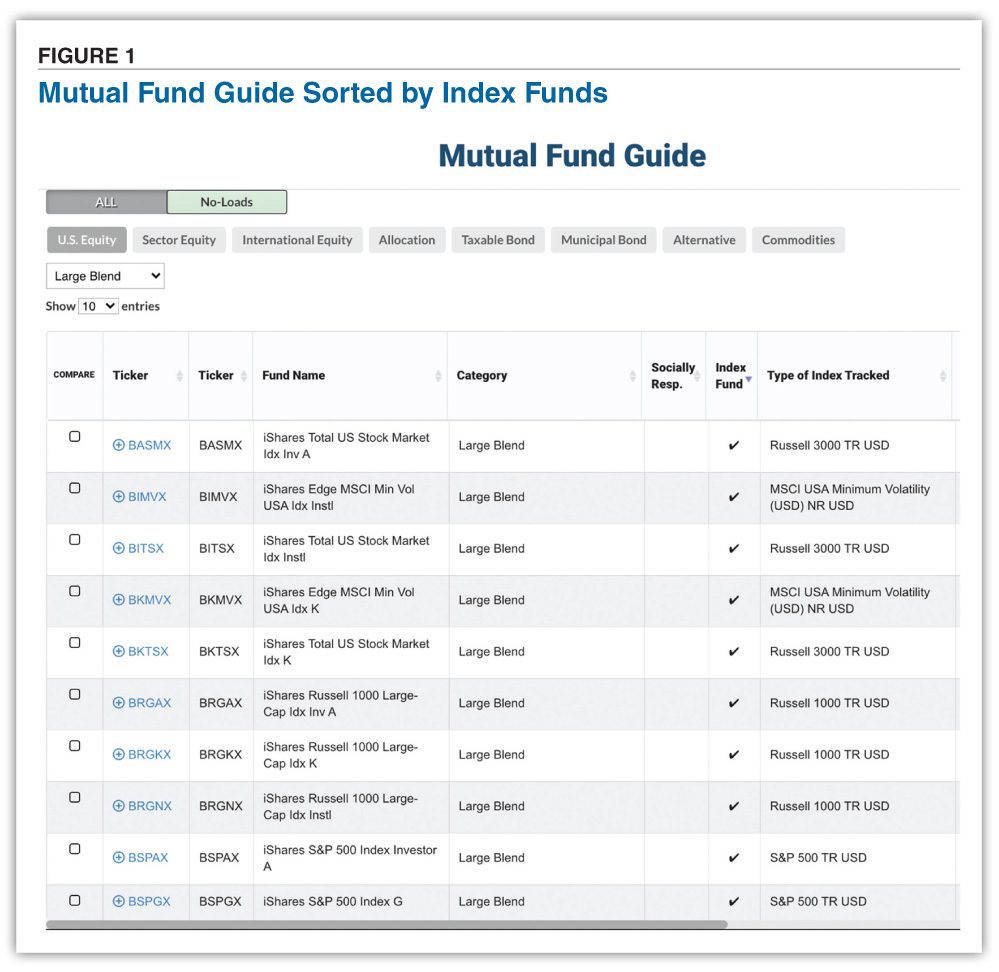
AAII members can find broad-based U.S. equity index funds by going to the Mutual Fund Guide, selecting U.S. Equity and then Large Blend from the category drop-down menu. From there, click on the “Index Fund” column heading twice in the table to sort by passively managed funds (Figure 1). Lists can be exported to an Excel file. The same filtering and sorting can be done at the ETF Guide.
A+ Investor subscribers can do a more nuanced search by using the Funds+ Screener. In the screener, first select Equity under Global Asset Class and U.S. Equity under Fund Group. From there, you can toggle the Index Fund option to Yes at the bottom of the Fund Type section of the screening criteria. For this screen, we also exclude institutional funds under Availability and special share class types in the Purchase section. [Editor’s Note: There are four ETFs in the AAII ETF database that track the S&P 500 total return index.]
The expense ratios for these 33 S&P 500 funds range from 0.01% for the Northern Stock Index fund  (NOSIX) to 2.41% for the Rydex S&P 500 C fund (RYSYX).
Compared to other mutual fund share classes, class C shares often have lower expense ratios than class B shares. However, they have higher expense ratios than class A shares. As a result, class C shares may be a good option for investors with a relatively short-term horizon, who plan to keep the mutual fund for just a few years.
The ongoing charges that constitute the C-share level load are officially known as 12b-1 fees. Total 12b-1 fees are capped at 1% annually. Other mutual fund share classes come with 12b-1 fees too but to different degrees. Those fees charged to class A shares usually are lower, compensating for the high upfront commissions this category pays. C shares tend to charge the maximum 1% and, since 12b-1 fees figure into the mutual fund’s overall expense ratio, their presence can push that annual expense ratio above 2% for the class C shareholder.
Expense ratios can and do play a role in the performance of a mutual fund. Over the last year, the Rydex S&P 500 C fund had the lowest return among these 33 funds (+9.0%), while the Northern Stock Index fund tied for the best (+11.8%) with the Mutual of America Equity Index (MAEIX), which has the second-lowest expense ratio of this group at 0.13%.
Over longer periods, the performance difference grows even more significant. Over the last five years, the Rydex S&P 500 C fund has an average annual gain of 8.7%—the lowest among these 33 funds—while the Northern Stock Index fund has an average annual gain of 11.4% over the same period, which is the highest in the group.
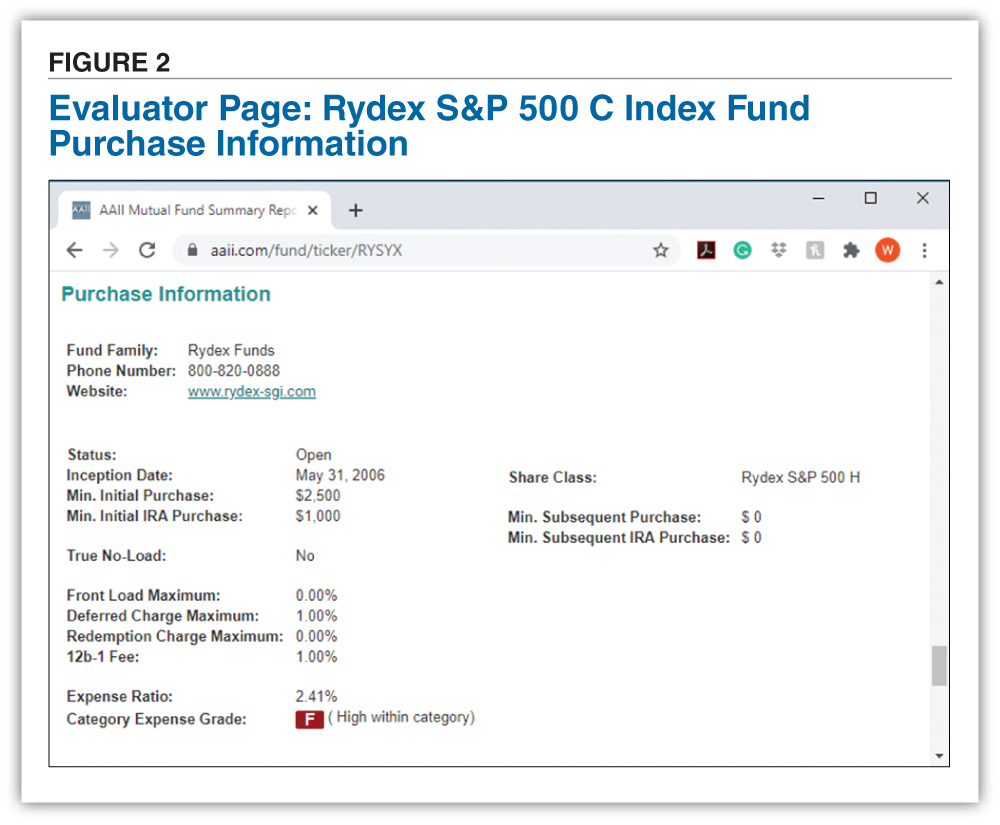
You can learn more about a fund’s cost structure by viewing the Purchase Information section, which is located at the bottom of its Fund Evaluator page. This data for the Rydex S&P 500 C fund can be seen in Figure 2.
Not only do we see that the fund’s expense ratio is 2.41%, the Category Expense Grade below it, which is F for this fund, shows how the fund compares to others in the same fund category.
This example reinforces the need to pay attention to how much you are paying for the privilege of owning a mutual fund. Seemingly small percentage differences in costs can add up over the long term.
From the Archives

Mutual Funds


BARRY J from TX posted almost 2 years ago:
You need to log in as a registered AAII user before commenting.
Log InCreate an account