



The 2023 review of AAII Stock Screens reveals that the Templeton approach is the top AAII guru strategy for the year.
The Templeton screen’s 2023 performance was impressive, with a 62.8% gain year to date through December 13, 2023. This strategy’s performance was even more impressive in a year where the typical stock gained 1.5% and value approaches lagged growth strategies. When evaluating the performance of a given stock screening approach, it is useful to look beyond the simple gain/loss data and examine the individual stocks that contributed to the overall return.
Sir John Templeton was an American-born British investor, banker, fund manager and philanthropist. While in college, Templeton studied under one of the forefathers of value investing, Benjamin Graham. With that first security analysis course, Templeton caught the contrarian bug and continued to train in the art of value investing. He was always out bargain hunting. Templeton was the constant comparison shopper—whether it was clothes, furniture, a home or stocks, he always looked for the best-priced bargains.
Two books served as the basis for the creation of our Templeton stock screen. Both books feature sections devoted to Templeton’s life and investing beliefs: “Lessons from the Legends of Wall Street,” by Nikki Ross; and “Money Masters of Our Time,” by John Train.
Templeton liked to compare the current price-earnings (P/E) ratio of a stock to its five-year average annual price-earnings figure when looking for the stocks with lower multiples. There are two hidden aspects of this screening criterion: Not only does it require the current price-earnings ratio of the stock to be lower than its five-year average, but in addition any passing company must have been traded for at least five years and had positive annual earnings per share for each of the last five fiscal years.
When screening against five-year averages, useless numbers can sometimes slip through the cracks in a screening technique. Beyond negative earnings, which lead to meaningless price-earnings ratios, unusually low earnings may also throw off standard price-earnings ratio screens. Because the average price-earnings ratio model relies on a normal situation, an additional filter was applied to the Templeton approach that excludes any stocks with ratios above 75 for any of the last five fiscal years.
Templeton believed that the income statement should show consistent earnings growth as well. Earnings per share growth is one of the primary benchmarks used to measure company performance. The Templeton screen looks for stocks with positive expected earnings growth and positive earnings growth over the last 12 months and each of the last four years. Beyond an overall growth figure, individual investors should look at the year-to-year trends, since long-term growth rates can easily mask the variability and risk of the underlying figures.
Templeton also sought companies with competitive advantages. This can be detected by comparing a stock’s forecasted earnings growth figures to the forecasted growth of its industry; firms with earnings growth estimates greater than or equal to that of the industry median more than likely have a competitive advantage.
Operating margins can also reveal a competitive advantage. The operating margin paints a picture of how efficiently the company’s management is operating within the framework of the company’s costs. Our screen requires the operating margin for the trailing 12 months and current year to be greater than or equal to the industry median for the respective periods. Industry comparisons are particularly important in this area as benchmarks because operating margin tends to be very industry specific.
Templeton also compared current operating margin to previous margins. Therefore, an additional filter requires the current operating margin to be greater than the five-year historical average operating margin.
Templeton also monitored the balance sheet, looking for companies showing good financial strength. Templeton believed that a strong financial position enables any company to work through the difficult periods often experienced by overlooked, out-of-favor stocks. Acceptable levels of debt vary from industry to industry, and for that reason the last criterion screens for companies with total liabilities relative to assets in the current quarter that are below their industry norms.
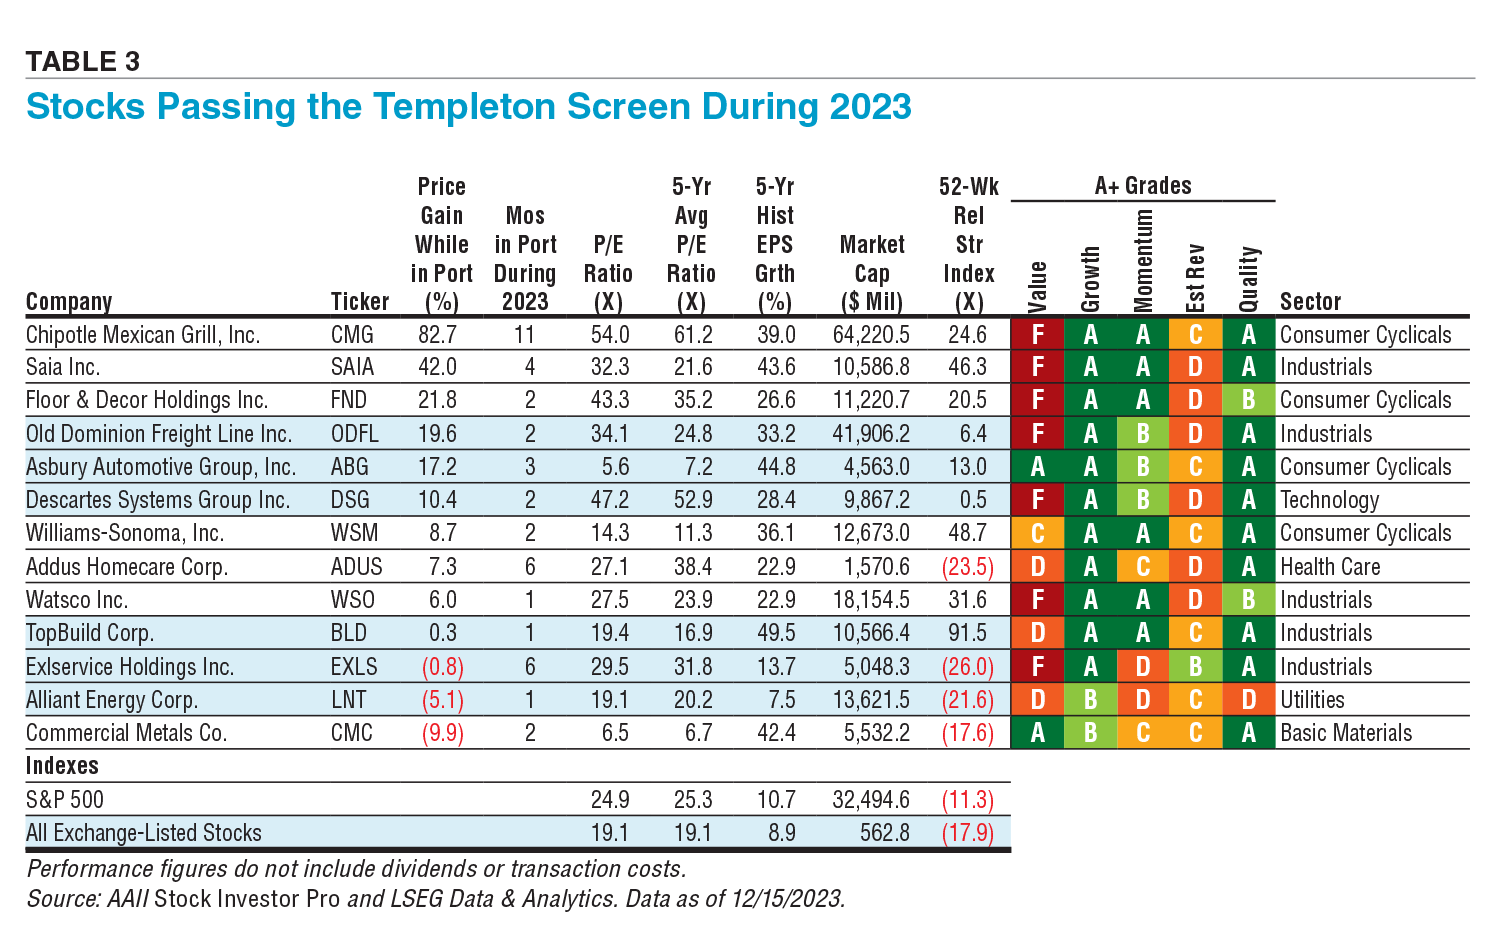
Only a handful of stocks have been passing the Templeton screen recently. The screen was fully invested throughout the entire year. However, the screen, on average, only generated three passing companies each month. For the year, 13 unique companies were uncovered by the screen.
Historically, the strategy has averaged one stock per month, whereas the typical AAII stock screen has averaged roughly 16 passing companies per month since the start of 1998.
When following a given strategy, spreading your investment among more stocks will lower your volatility, as investing in a small number of companies makes a portfolio more susceptible to individual stock price movements.
Table 3 presents the 13 stocks that passed the Templeton screen during 2023, showing their performance while they were held in the hypothetical portfolio, the number of months each stock was held this year and select financial data.
Download the Excel spreadsheet of Table 3.
Chipotle Mexican Grill Inc.  (CMG) was the best-performing stock that passed the Templeton screen in 2023. It was held in the portfolio for 11 months—only missing the screen at the end of January—and generated a cumulative price gain of 82.7% over that period. Chipotle’s current trailing price-earnings ratio is high compared to most stocks but below the stock’s five-year average ratio of 61.2. Chipotle’s trailing price-earnings ratio has expanded from 48.3 at the end of 2022 to 54.0 as of December 15, 2023. The company earns an A+ Value Grade of F because its valuation multiples are high compared to other companies. It passes the Templeton screen because the price-earnings ratio is low compared to its own historical average. Chipotle does earn grades of A for growth, momentum and quality.
Three of the companies that passed the Templeton screen in 2023 lost money while held in the hypothetical portfolio. The worst-performing stock from this group was Commercial Metals Co. (CMC), which fell 9.9% over February and March, the two months it was held in the portfolio.
The 2023 results for the Templeton screen are well above its long-term compound annual average gain of 9.3% since the start of 1998. It was able to achieve that success with a concentrated portfolio during 2023.
Discussion
FREE REPORT

NABIL M from DE posted over 2 years ago:
Christopher M from NJ posted over 2 years ago:
STEVEN R from KY posted over 2 years ago:
You need to log in as a registered AAII user before commenting.
Log InCreate an account