



Related

Stock Strategies
The Piotroski scoring system has grown into a popular approach to identify value stocks with solid and improving financials.

Derek Hageman leads a class in AAII's new Essential Investing Video Course. Go to https://www.aaii.com/ves for more information and to subscribe.
AAII’s Piotroski High F-Score strategy explores stocks with low share prices relative to their book value to see if it is possible to establish basic financial criteria to separate the winners from the losers. The Piotroski financial scoring system has grown into a popular approach to identify companies that have solid and improving financials.
Our Piotroski High F-Score screen segments firms by financial strength and is helpful in identifying both potentially attractive stocks as well as companies to avoid. Generally, portfolios comprising stocks with high F-Scores outperform those with lower F-Scores.
Joseph Piotroski, an accounting professor, set out to see if it was possible to use simple financial criteria to separate the winners from the losers among the universe of deep-value stocks. In his study, reported in the 2000 research paper “Value Investing: The Use of Historical Financial Statement Information to Separate Winners from Losers,” Piotroski noted strong evidence supporting the use of value multiples such as the price-to-book-value (P/B) ratio to build portfolios that outperform the market. But not all deep-value stocks turn out to be winners. Most academic researchers construct large portfolios that end up beating the market by holding a few big winners that overcome the many underperforming stocks in the portfolio.
Piotroski’s financial scoring system (F-Score) used nine criteria that he divided into broad categories:
Piotroski then scored each criterion with either a zero or a one, depending on a company’s underlying financials. Together the nine criteria make up a composite F-Score that has a maximum score of nine; the higher the score, the better. In his study, Piotroski compared the performance of “winners” (a score of eight or nine) and “losers” (a score of zero or one). He found that the winners outperformed the losers over the following year.
Stocks with a low share price relative to their book value make up the starting universe for Piotroski. Measures such as price-to-book ratio help to identify which stocks may be truly undervalued and neglected. The price-to-book ratio is determined by dividing market price per share by book value per share. Book value is generally determined by subtracting total liabilities from total assets and then dividing by the number of shares outstanding.
If accounting measures truly capture the value of a stock, then the stock should trade at a price near its accounting book value. However, this is typically not the case. Companies have some leeway when implementing accounting principles. While companies follow generally accepted accounting principles (GAAP), no two companies have the exact same accounting policies. The financial statements require many assumptions, judgments and estimates by management, which causes variations among firms even if management is not trying to distort or manipulate the numbers. Some firms are more conservative regarding how they report and track the values of revenues, costs, inventories, assets and even liabilities, while others are more aggressive. These decisions flow through the income statement and impact the book value of assets and liabilities.
Piotroski first limited his universe to the bottom 20% of stocks according to their price-to-book ratio, and this is our first screening criterion.
The Piotroski High F-Score screen is built into AAII’s Stock Investor Pro fundamental stock screening and research database. The companies meeting the criteria of this strategy each month are used to calculate hypothetical performance.
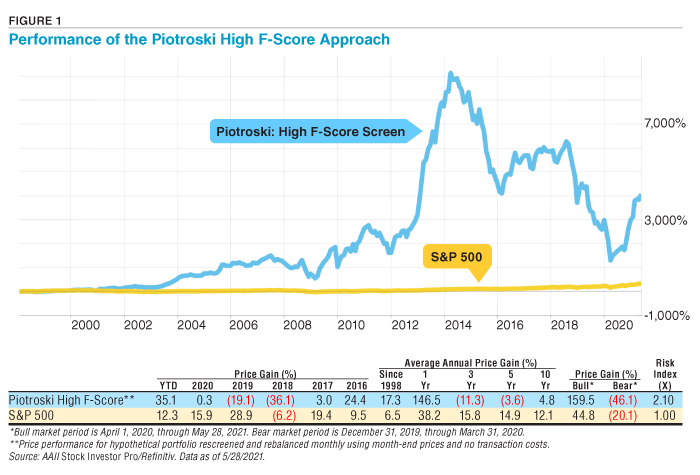
Figure 1 shows that the Piotroski High F-Score approach has outperformed the S&P 500 index since the beginning of 1998. It has generated a compound annual price gain of 17.3% over the period from January 1998 through May 28, 2021, while the S&P 500 is up 6.5% annually over the same period.
The Piotroski screen has been one of AAII’s top-performing screens over the long term, but with a great deal of variability from year to year. The Piotroski High F-Score strategy has outperformed year to date through May 28, 2021, rising 35.1% versus a gain of 12.3% for the S&P 500. However, the strategy significantly underperformed in 2018, down 36.1% versus a loss of 6.2% for the S&P 500 and in 2019, down 19.1%, while the S&P 500 gained 28.9%.
While the market does a good job of valuing securities in the long run, in the short run it can overreact to information and push prices away from their true value. The strategy has an average annual price loss of 11.3% a year over the last three years and a loss of 3.6% a year over the last five years, while the S&P 500 gained 15.8% and 14.9% over the same periods, respectively.
As an AAII member, you can follow the Piotroski High F-Score strategy’s performance and see how it compares to the other stock approaches that AAII tracks at the Screening area of AAII.com (choose Guru Screens from the dashboard). You can also see a monthly list of the stocks passing the screen.
Piotroski developed a nine-point scale that helps to identify stocks with solid and improving financials. Profitability, financial leverage, liquidity and operating efficiency are examined using popular ratios and basic financial elements that are easy to use and interpret. For this screen, a passing stock is required to have a score of eight or nine.
Piotroski awarded up to four points for profitability: one for positive return on assets, one for positive cash flow from operations, one for an improvement in return on assets over the last year and one if cash flow from operations exceeds net income. These are simple tests that are easy to measure. Because the requirements are minimal, there is no need to worry about industry, market or time-specific comparisons.
Return on assets examines the return generated by the assets of the firm. Return on assets is net income divided by total assets. A high return on assets implies that the assets are productive and well-managed. Operating cash flow is reported on the statement of cash flows and is designed to measure a company’s ability to generate cash from day-to-day operations as it provides goods and services to its customers.
The final metric in the profitability section of the F-Score calculation addresses the relationship between earnings and cash flow levels—accrual. Piotroski seeks companies with cash flow from operations that is greater than net income before extraordinary items. The measure tries to avoid firms making accounting adjustments to earnings in the short run that may weaken long-term profitability.
Piotroski awarded up to three points for capital structure and the firm’s ability to meet future debt obligations: one if the ratio of debt to total assets declined in the past year (change in leverage), one if the current ratio improved over the past year (change in liquidity) and one if the company did not issue any additional common stock (change in source of funds). Since many low price-to-book stocks are constrained financially, he assumed that an increase in financial leverage, a deterioration of liquidity or the use of external financing are signs of increased financial risk.
The remaining two elements examine the changes in the efficiency of operations. Companies gain one point for showing an increase in their gross margin and another point if their asset turnover has increased over the last fiscal year. The ratios reflect two key elements impacting return on assets.
Gross profit margins reflect the firm’s basic pricing decisions and its material costs. Gross income, or profit, is measured as revenue less the company’s cost of goods sold. Gross margin represents the proportion of each dollar of sales that the company retains as gross profit.
Asset turnover (total sales divided by average total assets) measures how well the company’s assets have generated sales. An increase in the asset turnover signifies greater productivity from the asset base and possibly greater sales levels.
Table 1 highlights the characteristics of stocks meeting Piotroski’s High F-Score screening criteria as of June 14, 2021.
Many of AAII’s screening approaches search for stocks that are attractively priced relative to some measure of intrinsic worth. These screens usually incorporate traditional valuation metrics such as price-earnings ratio or price-to-book ratio as primary screening criteria.
Stocks with a low share price relative to their book value is the starting universe for Piotroski. For the stocks currently matching the Piotroski approach, the median price-to-book ratio of 0.97 is significantly below the 2.51 median value for all exchange-listed stocks. The median price-earnings ratio and price-to-sales ratio for Piotroski stocks are also well below the median values of these metrics for all exchange-listed stocks. The median historical earnings-per-share growth rate for the Piotroski screen of 18.0% is above the 5.0% median value for all exchange-listed stocks.
The 11 companies that met the Piotroski High F-Score criteria as of June 14, 2021, are listed in Table 2 ranked by price-to-book ratio (lowest first). For a currrent list of passing companies, go here.
TABLE 2. Companies Currently Passing the Piotroski High F-Score Screen
(Ranked by Price-to-Book Ratio)
The Piotroski financial scoring system has grown into a popular approach to identify companies that have solid and improving financials. Piotroski’s segmentation of firms by financial strength continues to look helpful in identifying both potentially attractive stocks as well as companies to avoid. Generally, the higher the F-Score, the greater the average portfolio return.
The Piotroski financial scoring system helps form a fundamental framework to further analyze a company that looks to reward investors willing to take the time to do some basic homework.
Stock Strategies

Investing Gurus

Financial Statements

No comments have been added yet. Add your thoughts to the discussion!
You need to log in as a registered AAII user before commenting.
Log InCreate an account