Mutual funds and exchange-traded funds (ETFs) focused on mid-cap stocks, though often overlooked, can fit a happy medium in investors’ portfolios. They offer exposure to companies that share some of the stability of large-cap stocks, dividend income, growth, as well as the return premium of small-cap stocks. This combination gives mid-cap stocks the appeal of providing both diversification and growth through capital appreciation and dividends.
Diversification Benefits of Mid Caps
Mid-cap stocks, and thereby funds, offer diversification benefits relative to large- and small-cap stocks. Mid-cap stock funds have outperformed large-cap stock funds over time while historically incurring less risk than small-cap stock funds.
Table 1 illustrates the long-term return characteristics, putting the three asset size categories—along with micro-cap stocks, which are often grouped into the small-cap category—into perspective.
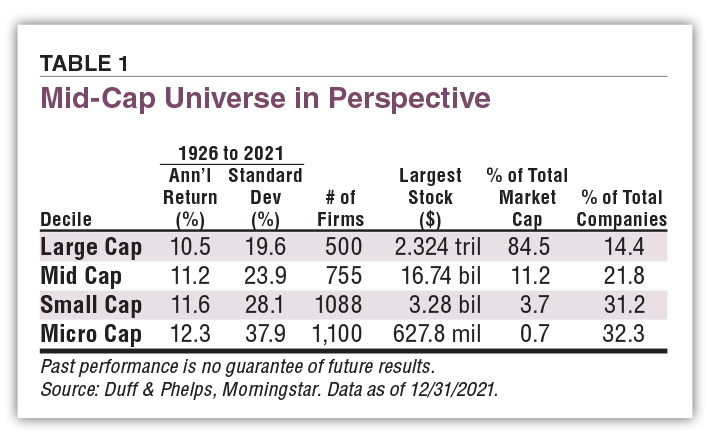
Between 1926 and 2021, mid-cap stocks have realized annualized returns similar to small-cap stocks, 11.2% to 11.6%, respectively. These two market-capitalization categories compare to large-cap equities’ annualized return of 10.5% over the same period.
Differences in volatility should also be noted. Large-cap stocks have the lowest standard deviation in their annualized return over the last 96 years at 19.6%. Volatility increases among the four market-cap categories as you move toward the smallest stocks.
Mid-cap stocks’ standard deviation of 23.9% puts it between the stability of large caps and the increased risk of investing in small-cap stocks, whose standard deviation is 28.1% over the same period.
Mutual funds and ETFs provide additional diversification by giving investors exposure to many mid-cap stocks via a single investment.
Opportunities for Growth
Companies that have matured out of their initial growth stages but still have opportunities to expand market share and grow both sales and earnings at a relatively strong pace can find themselves in the mid-cap arena.
These companies have grown out of their small-cap valuations but have yet to reach the size or stability of large-cap companies. Sizable spin-offs from large-cap companies can also be found among mid-caps. These are companies that may have greater opportunities to grow after no longer being grouped under a larger corporate umbrella.
Many Mid Caps Pay Dividends
Though not commonly discussed, many mid caps pay dividends. For instance, nearly two-thirds of the companies in the S&P MidCap 400 index pay a dividend. We point this out because the proportion of companies paying dividends tends to decline with market-cap size. As a general rule, the largest and most mature companies are the most likely to pay dividends while small, and often emerging, companies commonly pay little or no dividends.
As companies become established in their business model, grow more stable and generate consistent profits, they are in a better position to routinely share cash earnings with shareholders. On average, mid-cap blend, growth and value mutual funds yield 1.03%, 0.1% and 0.9%, respectively. For the mid-cap blend, growth and value ETF categories, the average yields are 0.5%, 0.1% and 2.1%, respectively.
For investors seeking higher returns but limits on their allocation to small stocks, funds concentrating on mid caps may make sense.
Discerning Among Mid-Cap Mutual Funds and ETFs
Whether you are interested in the growth potential of mid-cap stocks, seeking a higher return without significantly higher risk and/or adding diversification, the key to finding the right mid-cap mutual fund or ETF for you is to pay attention to what the fund actually holds and how it performs, despite whatever its name, prospectus or category marks it to be.
As a case in point, the generalized market-cap range of mid-cap stocks has changed over time. When we wrote about the nascence of mid-cap mutual funds 26 years ago (“Funds That Focus on the Mid-Caps: A Happy Medium Between Big & Small,” November 1996 AAII Journal), AAII reported a working range of greater than $500 million and less than $5 billion for mid-cap stocks.
Looking at Table 1 again, that working range is now much more applicable to the general range of small-cap stocks. The mid-cap range is currently between $2 billion and $10 billion. Definitions of market-cap range differ by source, though such differences tend to be at the margins. Still, this is why there are outliers in these ranges, as indicated by the largest market cap for each category.
Unless you do your due diligence, you might end up with a fund that is tilted more toward large caps when trying to get exposure to mid-cap stocks or follows an objective that only happens to place it in the mid-cap category circumstantially.
And while most funds that have mid-cap in their name are likely to have significant mid-cap holdings, there are other funds that have surprisingly large amounts of “mid-cap” holdings without stating this emphasis in their fund name.
This fuzziness of the boundaries between market-cap ranges is well documented in Tables 2 and 3, which report the average market cap of each fund’s holdings. Many of the top-performing mutual funds and ETFs across the mid-cap blend, growth and value categories have average market caps that are outside the mid-cap range as currently defined.
Table 2. Top Mid-Cap Mutual Funds by Category (Ranked by 5-Year Return)
Download the Excel spreadsheet.
|
Fund |
Ticker |
1-Yr Ret (%) |
1-Yr Ret Cat Grade |
3-Yr Ann’l Ret (%) |
3-Yr Ret Cat Grade |
5-Yr Ann’l Ret (%) |
5-Yr Ret Cat Grade |
Total Risk Index |
Exp Ratio (%) |
Total Assets ($ Mil) |
Market Cap ($ Mil) |
# of Holdings |
Mgr Tenure (Yrs) |
Closed |
Index Tracked |
|
Mid-Cap Blend |
|
(5.5) |
|
9.7 |
|
9.2 |
|
|
0.73 |
|
14,178 |
242 |
|
|
|
|
Janus Henderson Contrarian D |
JACNX |
(6.2) |
C |
15.8 |
A |
14.1 |
A |
1.39 |
0.90 |
5,328 |
25,856 |
47 |
4.08 |
X |
S&P 500 TR USD |
|
Schwartz Value Focused |
RCMFX |
(0.1) |
A |
14.6 |
A |
13.0 |
A |
1.70 |
1.27 |
25 |
25,267 |
23 |
14.17 |
|
S&P 1500 TR |
|
Government Street Mid-Cap |
GVMCX |
0.3 |
A |
13.7 |
A |
12.6 |
A |
1.14 |
1.09 |
59 |
23,129 |
79 |
18.46 |
|
S&P MidCap 400 TR |
|
Fidelity Mid-Cap Stock |
FMCSX |
1.2 |
A |
13.5 |
A |
12.2 |
A |
1.33 |
0.83 |
7,374 |
11,009 |
171 |
10.81 |
|
S&P MidCap 400 TR |
|
Paradigm Select |
PFSLX |
(11.0) |
F |
13.8 |
A |
12.0 |
A |
1.55 |
1.16 |
126 |
6,335 |
54 |
7.17 |
|
Russell 2500 TR USD |
|
FAM Dividend Focus Fund Investor |
FAMEX |
(4.5) |
B |
10.0 |
B |
11.7 |
A |
1.21 |
1.25 |
564 |
24,973 |
28 |
25.35 |
|
Russell Mid Cap TR USD |
|
Touchstone Mid Cap Y |
TMCPX |
(7.2) |
D |
8.5 |
D |
11.5 |
A |
1.15 |
0.93 |
4,460 |
13,173 |
34 |
7.98 |
|
Russell Mid Cap TR USD |
|
CRM Mid Cap Value Inv |
CRMMX |
1.8 |
A |
11.2 |
A |
11.3 |
A |
1.24 |
1.16 |
401 |
10,750 |
42 |
9.36 |
|
Russell Mid Cap Value TR USD |
|
Touchstone Mid Cap Z |
TMCTX |
(7.5) |
D |
8.2 |
F |
11.3 |
A |
1.14 |
1.22 |
4,460 |
13,173 |
34 |
8.48 |
|
Russell Mid Cap TR USD |
|
Thrivent Mid Cap Stock S |
TMSIX |
(5.1) |
B |
12.5 |
A |
11.3 |
A |
1.45 |
0.74 |
3,488 |
14,621 |
59 |
17.31 |
|
Russell Mid Cap TR USD |
|
Leuthold Select Industries |
LSLTX |
(3.8) |
B |
13.6 |
A |
11.2 |
A |
1.26 |
1.50 |
15 |
48,353 |
103 |
8.84 |
|
S&P 500 TR USD |
|
Cambiar SMID Investor |
CAMMX |
(7.5) |
D |
10.0 |
B |
11.0 |
A |
1.42 |
0.93 |
138 |
9,039 |
38 |
10.43 |
|
Russell 2500 Value TR USD |
|
CRM Small/Mid Cap Value Inv |
CRMAX |
(3.2) |
B |
10.8 |
B |
11.0 |
A |
1.36 |
1.16 |
154 |
6,397 |
44 |
4.08 |
|
Russell 2500 Value TR USD |
|
Vanguard Mid Cap Index Admiral |
VIMAX |
(4.5) |
B |
11.1 |
B |
10.9 |
A |
1.33 |
0.05 |
153,982 |
25,328 |
382 |
5.10 |
|
CRSP US Mid Cap TR USD |
|
iShares Russell Mid-Cap Index Inv A |
BRMAX |
(6.4) |
C |
10.2 |
B |
10.3 |
B |
1.35 |
0.36 |
1,626 |
19,552 |
832 |
5.57 |
|
Russell Mid Cap TR USD |
|
Mid-Cap Growth |
|
(18.4) |
|
9.7 |
|
12.1 |
|
|
0.86 |
|
18,678 |
215 |
|
|
|
|
Sparrow Growth No-Load |
SGNFX |
(26.9) |
F |
12.4 |
A |
18.5 |
A |
1.92 |
1.30 |
47 |
240,958 |
42 |
22.68 |
|
S&P 500 TR USD |
|
Kinetics Paradigm No Load |
WWNPX |
(10.1) |
A |
13.6 |
A |
16.4 |
A |
2.16 |
1.64 |
803 |
11,542 |
61 |
21.76 |
|
S&P 500 TR USD |
|
T. Rowe Price New Horizons |
PRNHX |
(27.4) |
F |
10.0 |
B |
14.9 |
A |
1.51 |
0.75 |
26,414 |
14,445 |
149 |
1.17 |
X |
Russell 2000 Growth TR USD |
|
Eventide Gilead N |
ETGLX |
(22.9) |
D |
9.2 |
C |
14.8 |
A |
1.57 |
1.31 |
3,912 |
21,987 |
79 |
11.57 |
|
S&P 500 TR USD |
|
Value Line Mid Cap Focused |
VLIFX |
(0.8) |
A |
12.2 |
A |
14.3 |
A |
1.14 |
1.07 |
434 |
17,388 |
31 |
10.67 |
|
S&P 500 TR USD |
|
VALIC Company I Mid Cap Strat Gr |
VMSGX |
(14.1) |
B |
11.6 |
A |
14.0 |
A |
1.38 |
0.78 |
788 |
18,156 |
137 |
5.72 |
|
Russell Mid Cap Growth TR USD |
|
Touchstone Mid Cap Growth Y |
TEGYX |
(9.6) |
A |
11.1 |
B |
13.9 |
A |
1.42 |
0.99 |
1,192 |
23,805 |
57 |
16.76 |
|
Russell Mid Cap Growth TR USD |
|
Fiera Capital Small/Mid-Cap Gr Inv |
APSRX |
(11.9) |
A |
14.1 |
A |
13.6 |
B |
1.45 |
1.30 |
105 |
11,448 |
63 |
2.75 |
|
Russell 2500 Growth TR USD |
|
American Beacon Stephens Mid Gr Inv |
STMGX |
(15.6) |
B |
9.3 |
C |
13.6 |
B |
1.41 |
1.14 |
577 |
19,090 |
97 |
16.01 |
|
Russell Mid Cap Growth TR USD |
|
Janus Henderson Enterprise D |
JANEX |
(8.1) |
A |
10.0 |
B |
13.5 |
B |
1.30 |
0.79 |
20,119 |
17,522 |
78 |
5.08 |
|
Russell Mid Cap Growth TR USD |
|
AMG TimesSquare Mid Cap Grth N |
TMDPX |
(9.7) |
A |
12.5 |
A |
13.5 |
B |
1.30 |
1.18 |
1,440 |
19,951 |
76 |
17.17 |
|
Russell Mid Cap Growth TR USD |
|
DF Dent Midcap Growth Investor |
DFDMX |
(16.9) |
B |
8.0 |
D |
13.4 |
B |
1.32 |
0.98 |
705 |
21,358 |
42 |
10.84 |
|
Russell Mid Cap Growth TR USD |
|
Artisan Mid Cap Investor |
ARTMX |
(23.2) |
D |
11.3 |
A |
13.1 |
B |
1.46 |
1.18 |
5,972 |
22,042 |
64 |
10.64 |
|
Russell Mid Cap TR USD |
|
Marsico Midcap Growth Focus Fund |
MXXIX |
(21.3) |
D |
9.0 |
C |
13.1 |
B |
1.44 |
1.33 |
273 |
22,597 |
51 |
9.84 |
|
Russell Mid Cap Growth TR USD |
|
Baird Mid Cap Growth Investor |
BMDSX |
(15.5) |
B |
9.8 |
C |
12.9 |
B |
1.39 |
1.05 |
1,968 |
19,012 |
56 |
18.93 |
|
Russell Mid Cap Growth TR USD |
|
Mid-Cap Value |
|
0.4 |
|
10.2 |
|
8.6 |
|
|
0.77 |
|
14,571 |
184 |
|
|
|
|
Diamond Hill All Cap Select Inv |
DHTAX |
(1.4) |
D |
14.8 |
A |
12.5 |
A |
1.60 |
1.16 |
407 |
14,976 |
33 |
6.87 |
|
Russell 3000 TR USD |
|
Fidelity Value Strategies |
FSLSX |
3.4 |
A |
14.6 |
A |
11.2 |
A |
1.56 |
0.86 |
1,449 |
11,979 |
94 |
5.05 |
|
Russell Mid Cap Value TR USD |
|
Fidelity Value |
FDVLX |
2.5 |
B |
14.8 |
A |
10.7 |
A |
1.70 |
0.79 |
9,271 |
8,771 |
259 |
11.90 |
|
Russell Mid Cap Value TR USD |
|
Fidelity Low-Priced Stock |
FLPSX |
(1.2) |
D |
12.3 |
A |
10.2 |
A |
1.24 |
0.65 |
29,683 |
8,890 |
848 |
8.24 |
|
Russell 2000 TR USD |
|
Heartland Mid Cap Value Investor |
HRMDX |
(0.2) |
D |
11.2 |
B |
9.8 |
A |
1.42 |
1.10 |
289 |
10,067 |
54 |
5.24 |
|
Russell Mid Cap Value TR USD |
|
Clifford Capital Partners Investor |
CLFFX |
(2.8) |
F |
9.1 |
C |
9.6 |
B |
1.49 |
1.15 |
75 |
10,377 |
31 |
6.76 |
|
Russell 3000 Value TR USD |
|
T. Rowe Price Mid-Cap Value |
TRMCX |
3.7 |
A |
12.9 |
A |
9.6 |
B |
1.39 |
0.78 |
14,557 |
13,102 |
97 |
19.43 |
|
Russell Mid Cap Value TR USD |
|
Vanguard Mid-Cap Value Index Adm |
VMVAX |
3.0 |
B |
10.8 |
B |
9.3 |
B |
1.38 |
0.07 |
29,460 |
23,975 |
210 |
0.61 |
|
CRSP US Mid Cap Value TR USD |
|
Pzena Mid Cap Value Investor |
PZVMX |
1.6 |
B |
13.4 |
A |
9.0 |
B |
1.97 |
1.25 |
130 |
12,362 |
42 |
7.34 |
|
Russell Mid Cap Value TR USD |
|
VALIC Company I Mid Cap Value |
VVMCX |
0.1 |
C |
10.8 |
B |
8.8 |
B |
1.42 |
0.80 |
832 |
12,865 |
212 |
8.49 |
|
Russell Mid Cap Value TR USD |
|
Ariel Focus Investor |
ARFFX |
(3.1) |
F |
10.3 |
B |
8.5 |
C |
1.55 |
1.00 |
70 |
17,878 |
31 |
15.76 |
|
Russell 1000 Value TR USD |
|
American Century Mid Cap Value Inv |
ACMVX |
3.7 |
A |
10.0 |
C |
8.3 |
C |
1.21 |
0.98 |
9,513 |
18,007 |
102 |
13.68 |
|
Russell Mid Cap Value TR USD |
|
Ariel Fund Investor |
ARGFX |
(8.3) |
F |
8.7 |
D |
8.1 |
C |
1.68 |
1.00 |
2,941 |
8,279 |
39 |
8.17 |
|
Russell 2500 Value TR USD |
|
Touchstone Mid Cap Value Y |
TCVYX |
0.6 |
C |
11.2 |
B |
8.1 |
C |
1.31 |
0.98 |
886 |
14,604 |
69 |
7.56 |
|
Russell Mid Cap Value TR USD |
|
Artisan Mid Cap Value Investor |
ARTQX |
(2.2) |
D |
8.8 |
D |
7.8 |
C |
1.53 |
1.21 |
1,890 |
16,484 |
51 |
7.83 |
|
Russell Mid Cap Value TR USD |
|
Source: AAII/Morningstar. Data as of 4/30/2022. |
Table 3. Top Mid-Cap ETFs by Category (Ranked by 5-Year Return)
Download the Excel spreadsheet.
|
ETF |
Ticker |
1-Yr Ret (%) |
1-Yr Ret Cat Grade |
3-Yr Ann’l Ret (%) |
3-Yr Ret Cat Grade |
5-Yr Ann’l Ret (%) |
5-Yr Ret Cat Grade |
Total Risk Index |
Exp Ratio (%) |
Total Assets ($ Mil) |
Market Cap ($ Mil) |
# of Holdings |
Mgr Tenure (Yrs) |
Index |
Index Tracked |
|
Mid-Cap Blend |
|
(5.5) |
|
9.7 |
|
9.2 |
|
|
0.73 |
|
14,178 |
242 |
|
|
|
|
Franklin LibertyQ US Mid Cap Eq ETF |
FLQM |
(1.3) |
B |
11.5 |
A |
12.0 |
A |
1.24 |
0.30 |
61 |
18,968 |
206 |
2.08 |
X |
LibertyQ US Mid Cap Equity TR USD |
|
Invesco S&P MidCap Quality ETF |
XMHQ |
(9.1) |
F |
12.9 |
A |
11.4 |
A |
1.25 |
0.25 |
330 |
6,787 |
79 |
13.43 |
X |
S&P MidCap 400 Quality TR USD |
|
JHancock Multifactor Mid Cap ETF |
JHMM |
(4.7) |
C |
11.1 |
A |
10.9 |
A |
1.34 |
0.41 |
2,411 |
15,492 |
663 |
5.68 |
X |
JH Dimensional Mid Cap TR USD |
|
Vanguard Mid-Cap ETF |
VO |
(4.5) |
C |
11.1 |
B |
10.9 |
A |
1.34 |
0.04 |
51,030 |
25,328 |
382 |
3.84 |
X |
CRSP US Mid Cap TR USD |
|
Invesco Russell 1000 Equal Weight ETF |
EQAL |
(2.2) |
B |
11.2 |
A |
10.6 |
A |
1.43 |
0.20 |
729 |
18,266 |
1,012 |
6.78 |
X |
Russell 1000 Equal Weighted TR USD |
|
First Trust Mid Cap Core AlphaDEX ETF |
FNX |
(4.8) |
C |
11.1 |
A |
10.6 |
A |
1.54 |
0.59 |
965 |
6,851 |
450 |
14.99 |
X |
NASDAQ AlphaDEX(R) Mid Cap Core TR USD |
|
iShares Russell Mid-Cap ETF |
IWR |
(6.3) |
D |
10.3 |
B |
10.5 |
B |
1.35 |
0.19 |
28,218 |
19,534 |
828 |
13.67 |
X |
Russell Mid Cap TR USD |
|
JPMorgan Divers Ret US Mid Cp Eq ETF |
JPME |
3.3 |
A |
11.6 |
A |
10.5 |
B |
1.32 |
0.24 |
247 |
14,931 |
373 |
3.38 |
X |
JPM Div Factor US MC Eq TR USD |
|
Xtrackers Russell US Multifactor ETF |
DEUS |
(0.8) |
B |
10.2 |
B |
10.0 |
B |
1.26 |
0.17 |
154 |
24,225 |
834 |
4.77 |
X |
Russell 1000 Comprehensive Factor TR USD |
|
iShares Morningstar Mid-Cap ETF |
IMCB |
(4.0) |
C |
9.8 |
C |
9.8 |
C |
1.31 |
0.04 |
783 |
20,544 |
569 |
14.09 |
X |
Morningstar US Mid Cap TR USD |
|
Schwab US Mid-Cap ETF |
SCHM |
(9.0) |
D |
8.5 |
D |
9.6 |
C |
1.44 |
0.04 |
9,173 |
10,537 |
504 |
2.77 |
X |
DJ US TSM Mid Cap TR USD |
|
SPDR Portfolio S&P 400 Mid Cap ETF |
SPMD |
(7.0) |
D |
9.9 |
C |
9.3 |
C |
1.43 |
0.05 |
5,044 |
6,695 |
400 |
8.26 |
X |
S&P MidCap 400 TR |
|
iShares Core S&P Mid-Cap ETF |
IJH |
(7.1) |
D |
9.9 |
C |
9.2 |
C |
1.43 |
0.05 |
61,318 |
6,695 |
406 |
13.42 |
X |
S&P MidCap 400 TR |
|
Vanguard S&P Mid-Cap 400 ETF |
IVOO |
(7.1) |
D |
9.8 |
C |
9.2 |
C |
1.43 |
0.10 |
1,427 |
6,759 |
402 |
4.05 |
X |
S&P MidCap 400 TR |
|
SPDR S&P MIDCAP 400 ETF Trust |
MDY |
(7.2) |
D |
9.7 |
C |
9.1 |
D |
1.42 |
0.22 |
18,701 |
6,759 |
400 |
26.09 |
X |
S&P MidCap 400 TR |
|
Mid-Cap Growth |
|
(18.4) |
|
9.7 |
|
12.1 |
|
|
0.86 |
|
18,678 |
215 |
|
|
|
|
Invesco S&P MidCap Momentum ETF |
XMMO |
(3.5) |
A |
12.4 |
B |
19.3 |
A |
1.15 |
0.33 |
894 |
8,553 |
79 |
13.92 |
X |
S&P MidCap 400 Momentum TR USD |
|
ARK Innovation ETF |
ARKK |
(60.6) |
F |
1.6 |
F |
15.5 |
A |
2.80 |
0.75 |
8,840 |
20,669 |
37 |
5.26 |
|
S&P 500 TR USD |
|
iShares Morningstar Mid-Cap Grth ETF |
IMCG |
(12.6) |
B |
12.8 |
A |
14.8 |
A |
1.38 |
0.06 |
1,087 |
19,726 |
370 |
12.01 |
X |
Morningstar US Mid Cap Brd Grt TR USD |
|
Alpha Architect US Quantitative Momt |
QMOM |
(12.4) |
B |
15.4 |
A |
13.0 |
A |
1.68 |
0.49 |
88 |
16,177 |
51 |
4.33 |
|
Alpha Architect Quantitative Mom NR USD |
|
Etho Climate Leadership US ETF |
ETHO |
(10.2) |
A |
11.5 |
B |
12.9 |
B |
1.31 |
0.47 |
165 |
15,826 |
275 |
3.16 |
X |
Etho Climate Leadership TR USD |
|
First Trust Mid Cap Grth AlphaDEX ETF |
FNY |
(12.6) |
C |
11.2 |
C |
12.8 |
B |
1.41 |
0.70 |
292 |
7,262 |
226 |
10.79 |
X |
NASDAQ AlphaDEX(R) Mid Cap Growth TR USD |
|
First Trust Multi Cap Gr AlphaDEX ETF |
FAD |
(9.9) |
A |
11.5 |
B |
12.6 |
B |
1.38 |
0.63 |
192 |
16,834 |
675 |
13.24 |
X |
NASDAQ AlphaDEX(R) Multi-C Growth TR USD |
|
Nuveen ESG Mid-Cap Growth ETF |
NUMG |
(17.7) |
C |
11.6 |
B |
12.5 |
B |
1.43 |
0.30 |
344 |
20,123 |
59 |
3.13 |
X |
TIAA ESG USA Mid Cap Growth GR USD |
|
Vanguard Mid-Cap Growth ETF |
VOT |
(12.0) |
B |
10.7 |
C |
12.1 |
C |
1.41 |
0.07 |
9,992 |
26,871 |
185 |
4.10 |
X |
CRSP US Mid Cap Growth TR USD |
|
iShares Russell Mid-Cap Growth ETF |
IWP |
(16.9) |
C |
8.5 |
D |
11.8 |
C |
1.43 |
0.23 |
12,006 |
21,561 |
394 |
13.42 |
X |
Russell Mid Cap Growth TR USD |
|
Janus Henderson Sm/Md Cp Gr Alpha |
JSMD |
(19.1) |
D |
7.0 |
F |
11.0 |
C |
1.49 |
0.30 |
150 |
6,553 |
265 |
4.02 |
X |
Janus Henderson S/M Cap Gr Alpha NR USD |
|
Motley Fool Mid-Cap Growth ETF |
TMFM |
(19.0) |
D |
6.2 |
F |
9.7 |
D |
1.36 |
0.85 |
230 |
14,209 |
32 |
7.87 |
|
Russell Mid Cap Growth TR USD |
|
Vanguard Extended Market ETF |
VXF |
(18.8) |
C |
8.7 |
D |
9.3 |
D |
1.58 |
0.06 |
14,033 |
7,120 |
3,695 |
4.17 |
X |
S&P Completion TR USD |
|
iShares S&P Mid-Cap 400 Growth ETF |
IJK |
(11.8) |
B |
9.0 |
D |
9.1 |
F |
1.34 |
0.17 |
6,940 |
7,512 |
237 |
12.09 |
X |
S&P MidCap 400 Growth TR USD |
|
Vanguard S&P Mid-Cap 400 Grth ETF |
IVOG |
(11.8) |
B |
9.1 |
C |
9.1 |
F |
1.33 |
0.15 |
741 |
7,634 |
233 |
4.21 |
X |
S&P MidCap 400 Growth TR USD |
|
Mid-Cap Value |
|
0.4 |
|
10.2 |
|
8.6 |
|
|
0.77 |
|
14,571 |
184 |
|
|
|
|
Cambria Shareholder Yield ETF |
SYLD |
(0.2) |
D |
20.3 |
A |
14.9 |
A |
1.81 |
0.59 |
515 |
7,467 |
101 |
7.56 |
|
S&P 500 TR USD |
|
SPDR Russell 1000 Yield Focus ETF |
ONEY |
7.4 |
A |
14.6 |
A |
12.1 |
A |
1.59 |
0.20 |
773 |
18,224 |
276 |
4.25 |
X |
Russell 1000 Yld Fcsd Fctr USRIC NR USD |
|
SPDR Russell 1000 Low Vol Foc ETF |
ONEV |
2.1 |
C |
11.8 |
B |
11.6 |
A |
1.25 |
0.20 |
571 |
18,269 |
435 |
4.92 |
X |
Russell 1000 LV Fcsd Fctr TR USD |
|
Invesco S&P MidCap 400 Revenue ETF |
RWK |
(1.8) |
F |
13.0 |
A |
10.6 |
A |
1.76 |
0.39 |
377 |
6,455 |
400 |
2.69 |
X |
S&P MidCap 400 Revenue-Weighted TR USD |
|
Principal Value ETF |
PY |
2.4 |
C |
11.7 |
B |
10.5 |
A |
1.53 |
0.15 |
231 |
19,172 |
123 |
3.95 |
X |
NASDAQ US Shareholder Yield TR USD |
|
Invesco S&P MidCap Val w/Momt ETF |
XMVM |
(2.5) |
F |
13.2 |
A |
9.8 |
B |
1.60 |
0.39 |
257 |
6,113 |
81 |
14.92 |
X |
S&P MidCap 400 Hgh Mmntm Value TR USD |
|
First Trust Dorsey Wrgt Momt & Div ETF |
DDIV |
5.4 |
B |
12.2 |
A |
9.4 |
B |
1.41 |
0.60 |
73 |
18,599 |
50 |
5.81 |
X |
Dorsey Wright Mom Pl Divid Yld TR USD |
|
Vanguard Mid-Cap Value ETF |
VOE |
3.0 |
B |
10.8 |
C |
9.3 |
B |
1.38 |
0.07 |
16,176 |
23,975 |
210 |
5.10 |
X |
CRSP US Mid Cap Value TR USD |
|
Nuveen ESG Mid-Cap Value ETF |
NUMV |
(0.2) |
D |
9.9 |
D |
9.2 |
B |
1.41 |
0.30 |
321 |
18,056 |
90 |
3.30 |
X |
TIAA ESG USA Mid Cap Value GR USD |
|
Vident Core US Equity |
VUSE |
0.8 |
C |
11.4 |
B |
9.1 |
C |
1.49 |
0.50 |
461 |
7,876 |
232 |
0.75 |
X |
Vident Core US Stock TR USD |
|
SPDR S&P 400 Mid Cap Value ETF |
MDYV |
(2.4) |
F |
9.8 |
D |
8.8 |
C |
1.59 |
0.15 |
1,497 |
6,015 |
295 |
10.50 |
X |
S&P MidCap 400 Value TR USD |
|
Vanguard S&P Mid-Cap 400 Value ETF |
IVOV |
(2.5) |
F |
9.8 |
D |
8.7 |
C |
1.59 |
0.15 |
794 |
6,024 |
297 |
4.55 |
X |
S&P MidCap 400 Value TR USD |
|
Invesco High Yield Eq Div Achiev ETF |
PEY |
5.9 |
A |
9.5 |
D |
8.7 |
C |
1.32 |
0.53 |
1,153 |
15,231 |
52 |
12.59 |
X |
NASDAQ US Dividend Achievers 50 TR USD |
|
iShares S&P Mid-Cap 400 Value ETF |
IJJ |
(2.5) |
F |
9.7 |
D |
8.6 |
D |
1.59 |
0.18 |
7,634 |
6,015 |
299 |
12.09 |
X |
S&P MidCap 400 Value TR USD |
|
iShares Morningstar Mid-Cap Value ETF |
IMCV |
4.3 |
B |
9.9 |
C |
8.5 |
D |
1.49 |
0.06 |
497 |
21,298 |
385 |
13.42 |
X |
Morningstar US Mid Cap Brd Val TR USD |
|
Source: AAII/Morningstar. Data as of 4/30/2022. |
Examples of How “Mid-Cap” Funds Can Differ
The top mid-cap value ETF over the last five years, the Cambria Shareholder Yield ETF (SYLD), uses the S&P 500 total return index as a benchmark in its summary prospectus, which is not a mid-cap index.
Despite leading the category and having an average market cap for its holdings of $7.5 billion that indicates a mid-cap strategy, the fund’s objective is based on investing in any stock with a market cap above $200 million that features high cash distribution based on Cambria’s quantitative model.
In its prospectus, the fund states that it generally expects to invest in “companies with larger market capitalizations.”
This is an example of an all-cap fund or a fund that is largely agnostic to market cap being grouped into a mid-cap asset class category. For the Cambria ETF, holdings in the mid-cap or small-cap category are accepted as a function of its objective. The inclusion of the Cambria ETF in the mid-cap value category isn’t a criticism of the fund itself, but rather shows the pitfalls of simply assuming a mutual fund’s or ETF’s categorization fully matches its objective. Funds are classified based on their portfolios—the characteristics of such portfolios may change if the objective allows for a broader size range to be considered.
In contrast to the Cambria ETF, consider CRM Mid Cap Value  (CRMMX). This mutual fund ranks in the top quintile in terms of five-year annualized returns for the mid-cap blend asset class category. Its principal investment strategy is to invest at least 80% of its assets in U.S. and non-U.S. stocks whose market caps at the time of purchase are “within the range of those in the Russell Midcap Value index.”
Unlike the Cambria ETF, CRM Mid Cap Value follows more of a pure mid-cap strategy. The categorization as mid-cap blend instead of mid-cap value is attributable to Morningstar’s analysis of the portfolio. Morningstar shows the fund’s holdings as having above-category-average valuation multiples. This may be attributable to the criteria Morningstar uses versus the valuation criteria used by CRM Mid Cap Value’s managers. (AAII uses Morningstar’s mutual fund and ETF categorizations.)
If the desire is to simply get exposure to mid-cap stocks, a fund whose objective clearly states similar goals can be a match. Investors who also desire a definitive value or growth tilt should be aware of the potential for differences between a fund’s objective and its classification. Some mutual funds and ETFs will explain how they determine value or growth, while others do not. There are also funds that provide an overview of their process but without enough clarity to make a firm judgment. Investors desiring a value or growth tilt will need to weigh how much transparency about a fund manager’s approach they want when selecting a fund.
Allocation Considerations
All three of AAII’s Asset Allocation Models contain a mid-cap stock element. The Vanguard Mid-Cap Index Admiral fund (VIMAX) is used to track the asset class category’s performance. An alternative is the Vanguard Mid-Cap Index ETF (VO). Both are mid-cap blend funds.
A large weight to mid-cap stocks can be found in the Aggressive Investor model. This model calls for a 20% allocation to mid-cap stocks, equal to the weightings for large-cap and international stocks. This model also has the highest overall equity allocation at 90%.
The moderate allocation model uses a 15% allocation to mid-cap stocks. It is below the 20% weighting for large-cap stocks but equal to the 15% allocation for international stocks. The moderate allocation has an overall equity allocation of 60%.
The conservative allocation uses a 10% allocation to mid-cap stocks. This is below the 15% weighting for large-cap stocks but equal to the 10% allocation for international stocks. The conservative allocation has an overall equity allocation of 40%.
The decreased allocation to mid-cap stocks in the moderate and conservative allocations reflects the higher emphasis on reducing volatility relative to the aggressive asset allocation model. As shown in Table 1 and discussed previously, large-cap stocks have historically experienced less volatility in returns than mid-cap stocks have.
Three Reasons to Consider Mid-Cap Funds
There are three primary arguments for considering an allocation to mid-cap stocks through a mutual fund or ETF.
One is diversification. Mid-cap stocks have historically outperformed large-cap stocks while being less volatile than small-cap stocks. Allocating solely to large-cap and/or small-cap stocks misses this key segment of the U.S. market.
Two is the potential for growth. Many mid-cap companies are those that have either emerged from their initial growth stage or have been spun off from larger corporate parents. Both may be positioned to realize strong growth in sales and earnings going forward.
The third reason is income. It is not uncommon to find mid-cap stocks that have achieved a certain level of stability and scale. This combination of profitability and established business model better allows such companies to routinely share cash earnings with shareholders. As we showed, many mid-cap mutual funds and mid-cap ETFs provide dividend income.








Sneha J from IND posted over 4 years ago:
BARRY J from TX posted over 4 years ago:
You need to log in as a registered AAII user before commenting.
Log InCreate an account