


Related

ETFs and Mutual Funds
The focal points of economic concern during the first quarter of 2022 haven’t shifted in the second quarter of 2022, affecting performance for many fund and ETF categories.

The focal points of economic concern during the first quarter of 2022—from high inflation to the war in Ukraine—haven’t shifted in the second quarter of 2022. The concern stemming from these two events has done little but solidify into reality. Inflation is still at a 40-year high, and the effects of Russia’s invasion of Ukraine on global supply are still pressuring commodity prices.
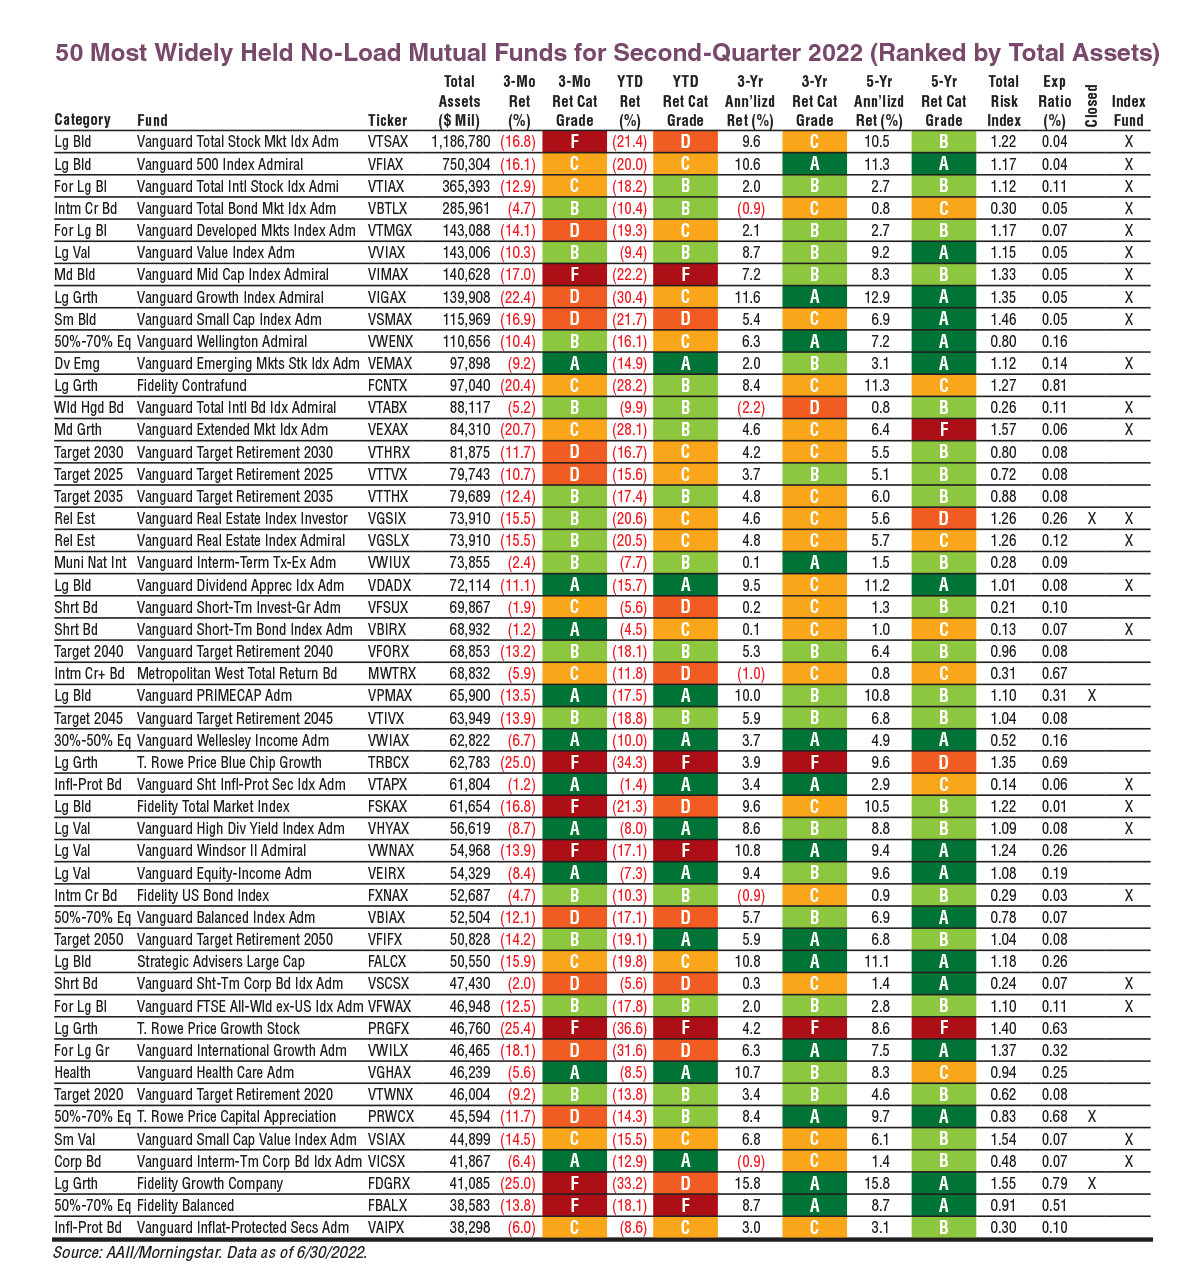
The second quarter marks the worst performance for equities since the bear market of 2020 at the onset of the coronavirus pandemic. The most widely held no-load mutual fund, Vanguard Total Stock Market Index  (VTSAX), lost 16.8% for the three-month period ending June 30.
This fund is mostly composed of the largest domestic technology stocks—its top-weighted holdings are Apple Inc. (AAPL), Microsoft Corp. (MSFT), Amazon.com Inc. (AMZN), Google’s parent company Alphabet Inc. (GOOGL) and Tesla Inc. (TSLA). The fund’s performance cements the secondary narrative for the quarter: Growth stocks were particularly hurt by the effects of the Federal Reserve raising interest rates in response to inflation.
The continuing slide of the same problems from the first quarter into the second quarter of 2022 turned the first half of the year into the worst in recent memory. Neither equities nor fixed-income assets were spared. A brief inversion of the yield curve in March and a brief dip into bear market territory for the S&P 500 index in June highlight investors’ concerns of a looming recession. Some ultrashort bond mutual funds made the list of top performers due to interest rate changes.
While a recession isn’t guaranteed, what the first half of 2022 shows is the genius of holding a diversified portfolio of assets in conjunction with sticking to a long-term strategy. These are strange economic times with high inflation, rising interest rates, strangled supply chains and a job market that is still showing strength. No one knows what’s going to happen next, but that was never the case in the past either.
The top 25 and bottom 25 ETFs and mutual funds shown in this article represent the best- and worst-performing funds in each respective universe. Mutual funds are required to have at least $5 million of assets under management (AUM), a minimum initial purchase amount of no more than $50,000 and not charge any front- or back-end loads. ETFs are required to have AUM of at least $25 million and an average daily trading volume of at least 5,000 shares. Leveraged funds were excluded. The 50 most widely held mutual funds are the funds most likely owned by AAII members, allowing you to note the performance of funds held by a large number of individual investors.
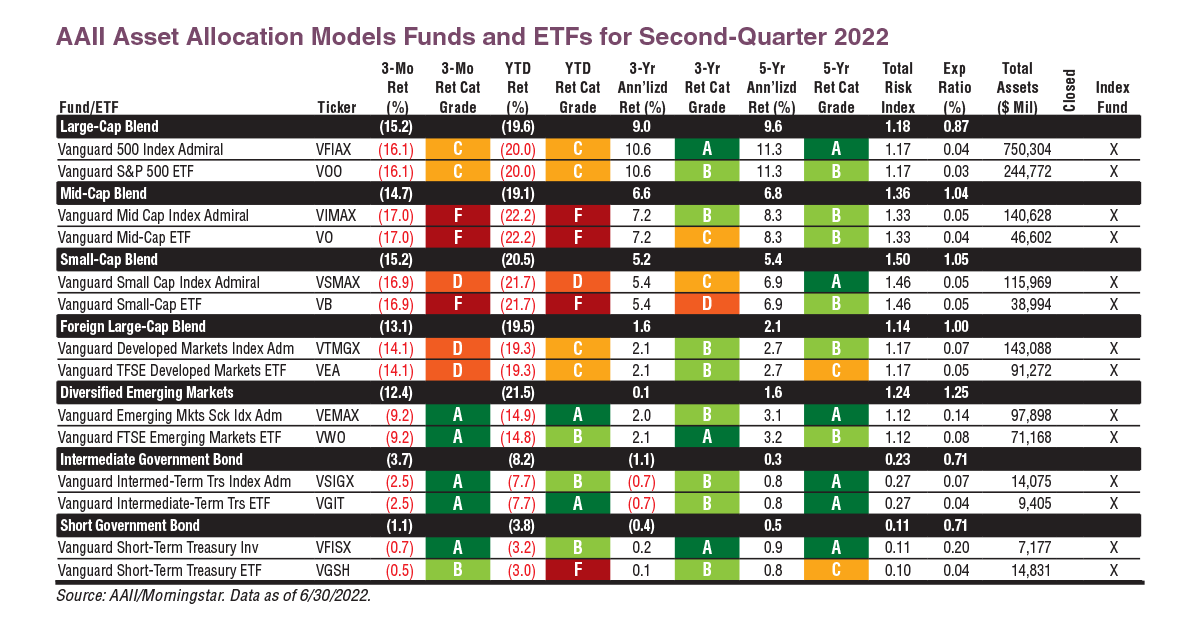
The AAII Asset Allocation Models have long served as guidelines that individual investors can use to help construct appropriate portfolios. The models incorporate three key building blocks to a successful allocation strategy: stocks, bonds and cash. [Short-term bonds are listed as a proxy for cash but can easily be substituted with cash equivalents such as money market funds, certificates of deposit (CDs), etc.]
Each model—aggressive, moderate and conservative—applies to investors with different levels of risk tolerance. The performance of the three models is based on hypothetical portfolios comprising mutual funds that represent each asset class. Vanguard index funds are used to limit the impact that decisions by active managers have on returns. These funds were also selected for their very low expense ratios. Vanguard is unique in that many of its ETFs are separate share classes of its mutual funds. This can be seen on the company’s website where the phrase “also available as an ETF” is listed on the pages of the admiral share class versions of the mutual funds.
Along with quarterly returns, the table shows the year-to-date and annualized three-year and five-year returns with category grades for the funds used to track the models’ returns. We include two additional perspectives for each asset class group. The first is the category average return of similar mutual funds (e.g., large-cap blend, mid-cap blend, etc.). The second is the performance of similar Vanguard ETFs.
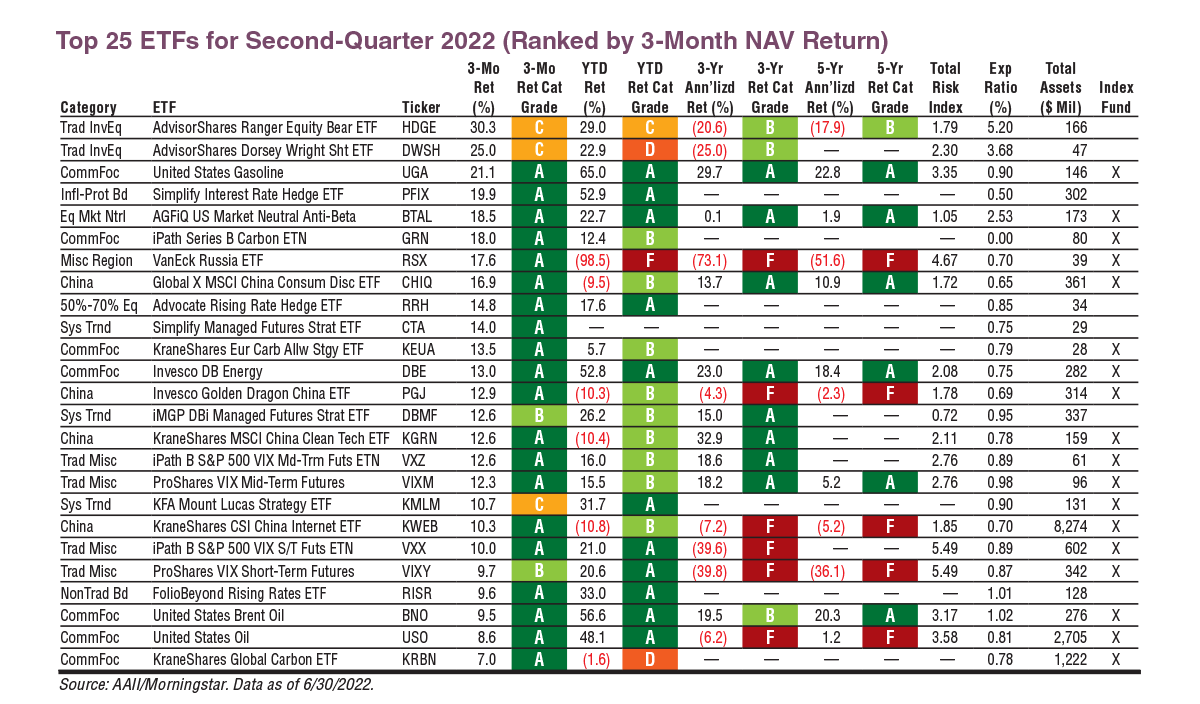
Top-performing ETF categories for the second quarter were commodities, China, miscellaneous trading and systematic trend. Each of these four categories had at least three funds among the top 25 ETFs.
Download the Excel spreadsheet of this table.
Of the seven focused commodities ETFs on the list, the top quarterly return of 21.1% belonged to United States Gasoline (UGA), which tracks the movements of gasoline prices as measured by the daily changes in the price of futures contracts. Most are aware of those price increases, given how different the average price of regular gasoline is now relative to a year ago: $4.651 versus $3.146, respectively, as of July 13, 2022, according to the American Automobile Association (AAA).
The top two ETFs belong to the inverse equity trading category. For the quarter, AdvisorShares Ranger Equity Bear ETF (HDGE) returned 30.3% and AdvisorShares Dorsey Wright Short ETF (DWSH) returned 25.0%. As their fund names and category imply, these funds do well when equity indexes don’t do well.
Specifically, ETFs in this category seek to generate returns equal to an inverse fixed multiple of short-term returns of an equity index. If that description means nothing to you as the average long-term investor, that’s good since these funds are only considered suitable for active traders, according to Morningstar. ETFs in this category don’t follow strategies that reliably provide stable long-term performance.
They’re also quite expensive compared to the majority of index ETFs, which emphasize their low expense ratios. AdvisorShares Ranger Equity Bear has an expense ratio of 5.20% and AdvisorShares Dorsey Wright Short has an expense ratio of 3.68%. The Vanguard S&P 500 ETF (VOO) has an expense ratio of 0.03%. This fund represents large-cap equity in AAII’s model asset allocations.
In general, the ETFs and mutual funds within the “trading” categories are meant for active traders looking to hedge on speculation, not long-term investors looking to preserve and grow capital over the lifetime of the market.
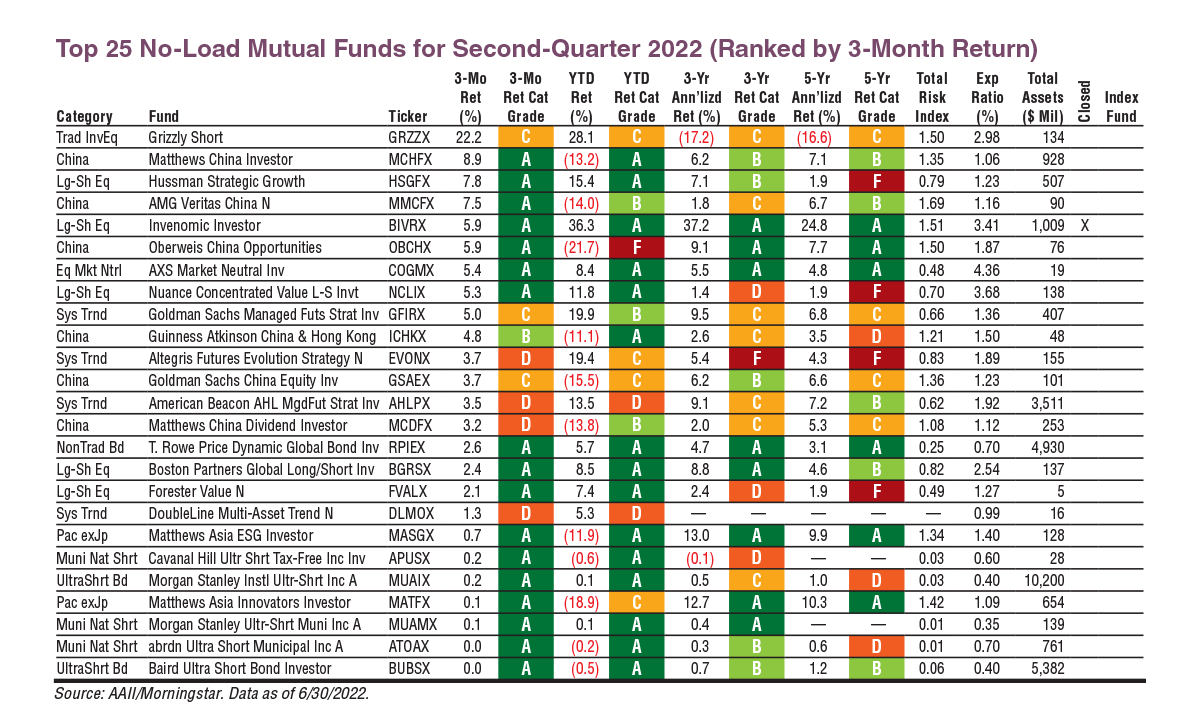
A similar mutual fund, Grizzly Short (GRZZX) topped returns for the second quarter with 22.2%. Of the top 25 mutual funds, nothing else broke through with double-digit returns for the quarter. The major trends in categories for the top mutual funds paralleled those of the top ETFs, featuring funds focused on China and strategies betting against the market.
According to data from Refinitiv’s Lipper FundMarket Insight Report, China region funds were the only international equity funds to have positive returns for the quarter. Six mutual funds focused on China are among the top 25, led by Matthews China Investor (MCHFX) with a return of 8.9%.
At the beginning of the year, China struggled with lingering lockdowns to suppress outbreaks of the corona-virus under its “zero-COVID” strategy. China has yet to fully release an equivalent mRNA vaccine to those by Pfizer-BioNTech and Moderna, which have been widely used in the U.S. and globally. Instead, most of its population has received less effective inactivated-virus vaccines. But with lockdowns easing from the first quarter, China funds are rebounding enough to put them among the top funds for the second quarter.
The other prominent category for top-performing mutual funds this quarter is long-short equity. Long-short mutual funds hold sizable stakes in both long and short positions in equities, exchange-traded mutual funds (ETMFs) and related derivatives. Some mutual funds that fall into this category will shift their exposure between long and short positions depending on their macro-economic outlook or the opportunities they uncover through bottom-up research, according to Morningstar’s definition.
Hussman Strategic Growth (HSGFX) returned 7.8% for the second quarter as the top-performing long-short equity mutual fund on the list.
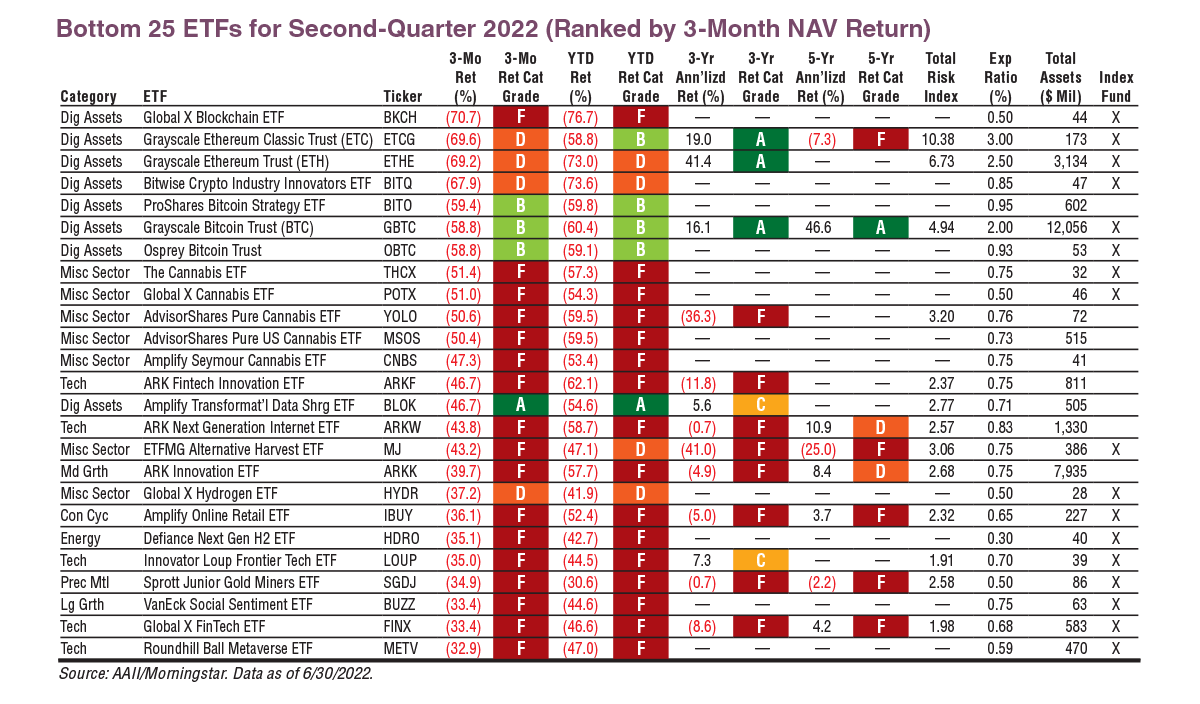
In terms of bottom-performing ETFs, it was a bad quarter for funds involved with cryptocurrencies and cannabis as investors pulled back from these nascent and speculative sectors. Notably, many of the bottom-performing ETFs for the second quarter lack a history of returns going back even three years.
Nonetheless, the interest in cryptocurrencies has yielded its own fund category—digital assets—from Morningstar, while cannabis funds are resigned to the miscellaneous sector.
Download the Excel spreadsheet of this table.
Perhaps telling of the situation for digital assets, the two ETFs in this category with five-year returns, Grayscale Ethereum Classic Trust (ETCG) and Grayscale Bitcoin Trust (GBTC), have total risk index values of 10.38 and 4.94, respectively. A value of 1.00 is average risk, so these funds are extremely risky. On top of being risky, both of these funds are hugely expensive for index ETFs. Grayscale Ethereum Classic Trust has an expense ratio of 3.00% and Grayscale Bitcoin Trust has an expense ratio of 2.00%.
It is prudent to mention that while the digital assets are not going away as a technology or as a form of business, the sector is still filled with much speculation. The exuberance surrounding digital assets at times feels close to what occurred in the late 1990s and early 2000s with internet companies.
Download the Excel spreadsheet of this table.
Five ETFs in the technology category bring the total of tech and digital asset ETFs in the bottom performers to 13 out of 25 funds. Rounding out the bottom 25 are growth strategies—which we’ve touched on as underperforming this year so far—and other nascent and speculative businesses such as hydrogen fuel. The latter is represented by Global X Hydrogen ETF (HYDR), down 37.2% for the quarter, and Defiance Next Gen H2 ETF (HDRO), down 35.1%. Defiance has no long-term performance history but it does have a cool website, so it has that going for it!
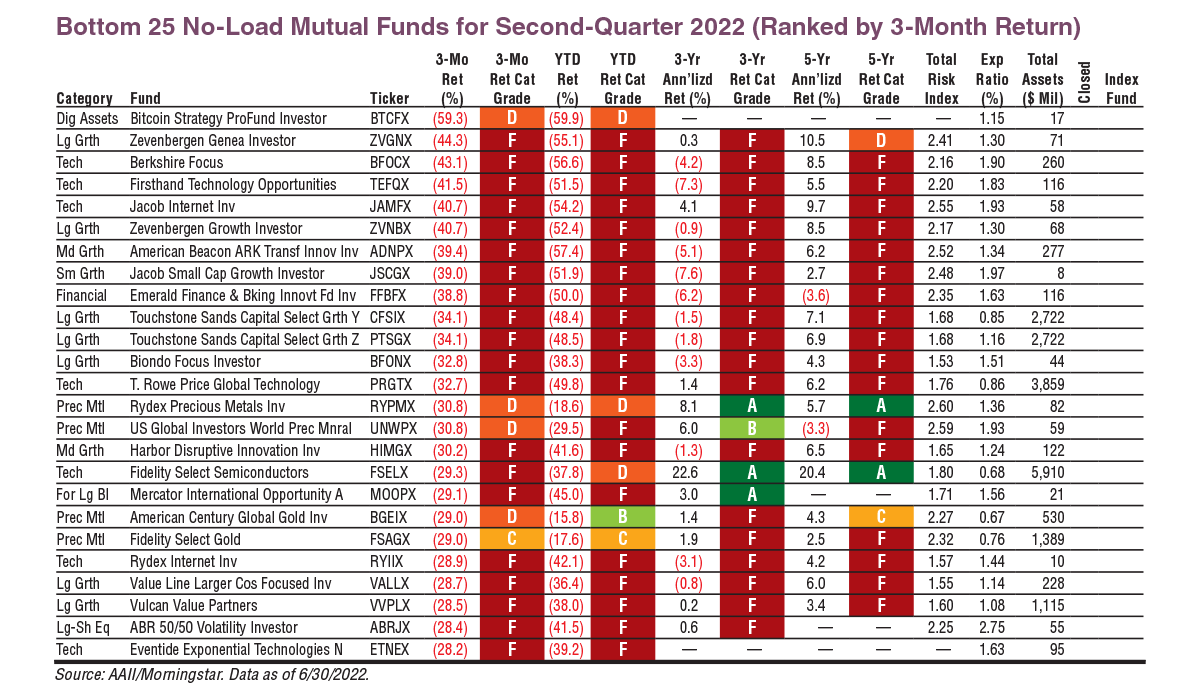
The list of bottom-performing mutual funds for the second quarter is less concentrated in technology and speculative sectors. However, Bitcoin Strategy ProFund Investor (BTCFX) did lead the charge into the red with a loss of 59.3% for the last three months. It also has no long-term performance, and is relatively small with only $17 million in total assets.
Download the Excel spreadsheet of this table.
More prominent on the bottom mutual fund list this quarter are growth strategies across market-capitalization sizes and funds focused on precious metals. Investors tend to move money out of gold when fixed-income assets offer more competitive yields. While investors had little incentive to lock up capital with low-yielding fixed-income assets over roughly the last decade in lieu of investing in equities or alternatives, such as gold, rising interest rates are changing investor behavior. There isn’t a studied strong relationship between returns on gold and higher interest rates, but there is likely some correlation in the short-term during 2022.
Download the Excel spreadsheet of this table.
Among the funds and ETFs shown on the Asset Allocation Model table, Vanguard’s short government bond funds—Vanguard Short-Term Treasury fund (VFISX) and corresponding ETF (VGSH)—performed the best in the second quarter. Investors are turning to short-term fixed-income assets as interest rates rise with higher inflation.
Download the Excel spreadsheet of this table.
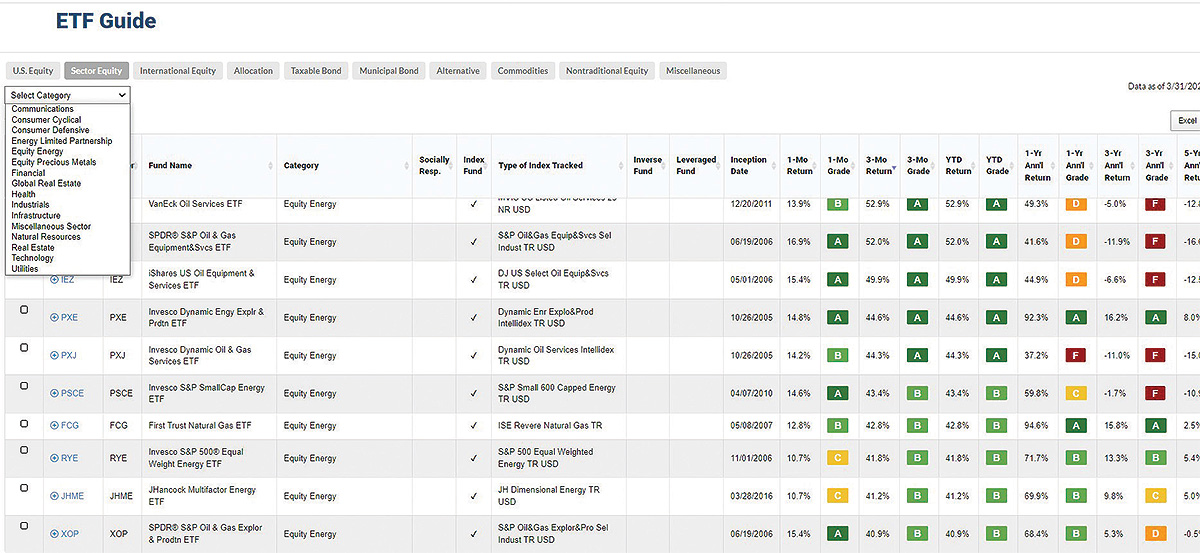
Online data on more than 24,000 mutual funds and 3,000 ETFs is updated monthly and available to all AAII members. Visit www.aaii.com/investingideas to access our mutual fund and ETF guides, lists of consistent performers, fund comparison tools and more.
ETFs and Mutual Funds

PRISM Wealth-Building Process

Portfolio Strategies

JOHN L from NJ posted over 4 years ago:
WILLIAM S from ID posted over 4 years ago:
BARRY J from TX posted over 4 years ago:
BARRY J from TX posted over 4 years ago:
You need to log in as a registered AAII user before commenting.
Log InCreate an account