



- Our new series is designed to enhance your ability to make a sound judgment about a company’s financial strength and future prospects
- The income statement shows whether a company made or lost money over a given period, while the cash flow statement shows how much money is going in and out
- Analysts use balance sheets to determine trends in assets and liabilities
Financial statement analysis is a key aspect of researching stocks for investment. Financial statements provide snapshots of a company’s financial health and performance from various perspectives. The U.S. Securities and Exchange Commission (SEC) requires publicly traded companies to file quarterly and annual reports containing their latest financial statements on an ongoing basis. The role of financial reporting for companies is to provide information about their fiscal health and financial performance.
As investors, we use financial reports to evaluate the past, current and prospective position of a company. Analyzing the information found in financial statements forms the basis of most investing strategies used by individual and institutional investors. These statements allow us to place a value on a stock’s worth and to compare one firm to another.
Through this new financial statement analysis series, we show the benefits of using financial statements in your personal investing research. Our goal is to enhance your ability to make a sound judgment about the financial strength and future prospects of a company.
Of necessity, many concepts covered in this series may seem very basic. However, to build a strong understanding of advanced topics you need a solid foundation. As we progress through this series, you’ll find more advanced topics discussed.
In this introductory article, I explain the major components of each of the three main financial statements: The income statement, the balance sheet and the statement of cash flows. While there are other financial disclosures that companies make, these three statements are arguably the most looked at and frequently used. We present images of Alphabet Inc.’s  (GOOGL) recent financial statements as illustrations.
Income Statement
The income statement can be best summarized as stating whether a company made or lost money over a given period. The income statement reports how much revenue (sales) the company generated during the period, the expenses it incurred and the resulting earnings or losses.
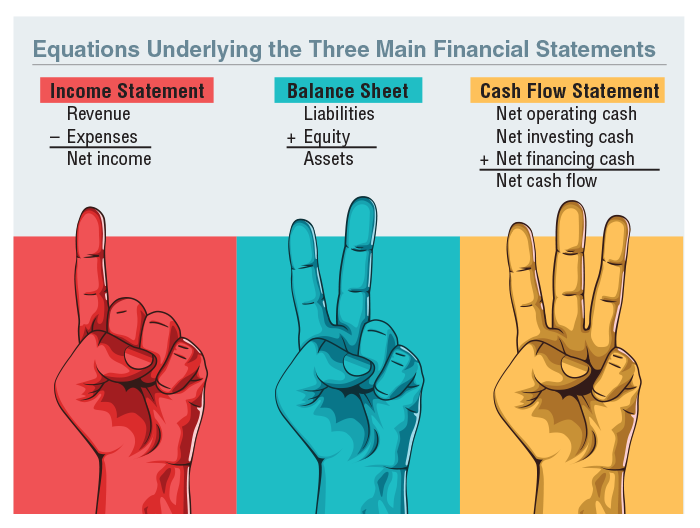
The basic equation underlying the income statement is revenue less expenses equals net income. All companies use a reporting period of one year. The 12-month period can either match the calendar year or can start and end on other dates (fiscal year). Retailers, for instance, commonly operate on February to January fiscal years instead of January to December calendar years.
The income statement contains several significant details that are pertinent to stock analysis. Tracking the trend in sales, costs and profits helps analysts determine if the company is growing profits at a high or low rate. The direction and pace of change in “top line” revenue as well as “bottom line” net income impact judgment of a firm’s worth. Companies with strong revenue and earnings growth are frequently rewarded by investors with higher valuations.
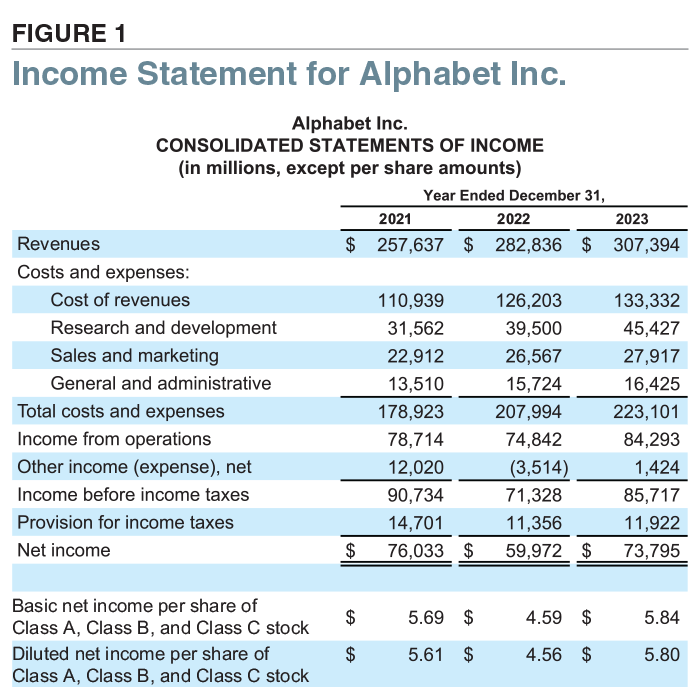
In addition to revenue and net income, the income statement provides earnings per share (net income per share in Figure 1). Earnings per share are simply the earnings the company generated for the period divided by the number of outstanding shares of the company’s stock. This calculation tells you the dollar amount of earnings each share of stock has claim to.
Earnings can be distributed to shareholders via dividends or stock buybacks, though most companies retain a significant portion of earnings to fund future growth. We’ll discuss earnings in greater detail—including how earnings per share can be manipulated by companies—in a future article in this series.
Alphabet’s income statement is shown in Figure 1. At the very top of the statement are revenues (hence the term top-line). Net income is provided near the bottom (a bottom-line item). Alphabet’s income statement shows that revenues have been growing year over year for the past few years. Net income declined between 2021 and 2022, but then rebounded in 2023.
Balance Sheet
The balance sheet offers crucial information about a company’s financial health. The balance sheet is unique in terms of its reporting period: It gives a snapshot of a firm’s financial position on a particular date instead of for a full quarter or year.
 The balance sheet provides information on what a company owns (assets), owes (liabilities) and the shareholder ownership interest (equity). The equation underlying the balance sheet can be remembered with the simple acronym ALOE, which stands for assets equal liabilities plus owner’s equity. This financial statement has two parts or sides—assets and liabilities—and the bottom line of each side must be the same number, hence the name balance sheet.
Analysts use balance sheets to determine trends in assets and liabilities and to understand how adequately the firm is financed.
Assets are items of value owned by a company. Assets include physical property, such as plants, trucks, equipment and inventory (tangible assets). Assets can be intangible, like trademarks or patents. Money owed to the company but not yet paid (receivables) are assets. Cash and investment securities held by the company are also assets.
Liabilities are amounts owed by a company. They usually include lines of credit, rent, dollars owed to suppliers of services and materials (payables), bonds issued and loans taken. Liabilities also include obligations to provide goods or services to customers in the future or other costs spanning a period of years (deferred). Liabilities are broken down into current or long-term. Current liabilities are those that are due within one year, while long-term liabilities are those due after one year.
Shareholder’s equity is the accounting value of ownership that shareholders have claim to. It is the theoretical value of what is left for shareholders if all noncash assets are sold and all liabilities are paid. Shareholder’s equity is commonly referred to as book value, since it is the net value of a company reported on its “books” (statements).
Among the line items comprising shareholder’s equity are common stock, retained earnings and treasury stock. Common stock represents the amount of capital raised by the company via issuance of common stock. Retained earnings is the cumulative portion of a company’s net income that has been reinvested in the business rather than paid out to shareholders.
Figure 2 presents Alphabet’s balance sheet. Cash is presented on the assets side under current assets, and long-term debt is a separate line item on the liabilities side. Alphabet’s total assets significantly increased in 2023, with property and equipment rising the most. Current liabilities also increased significantly, with the line item of accrued expenses and other current liabilities increasing $8.3 billion between 2022 and 2023.
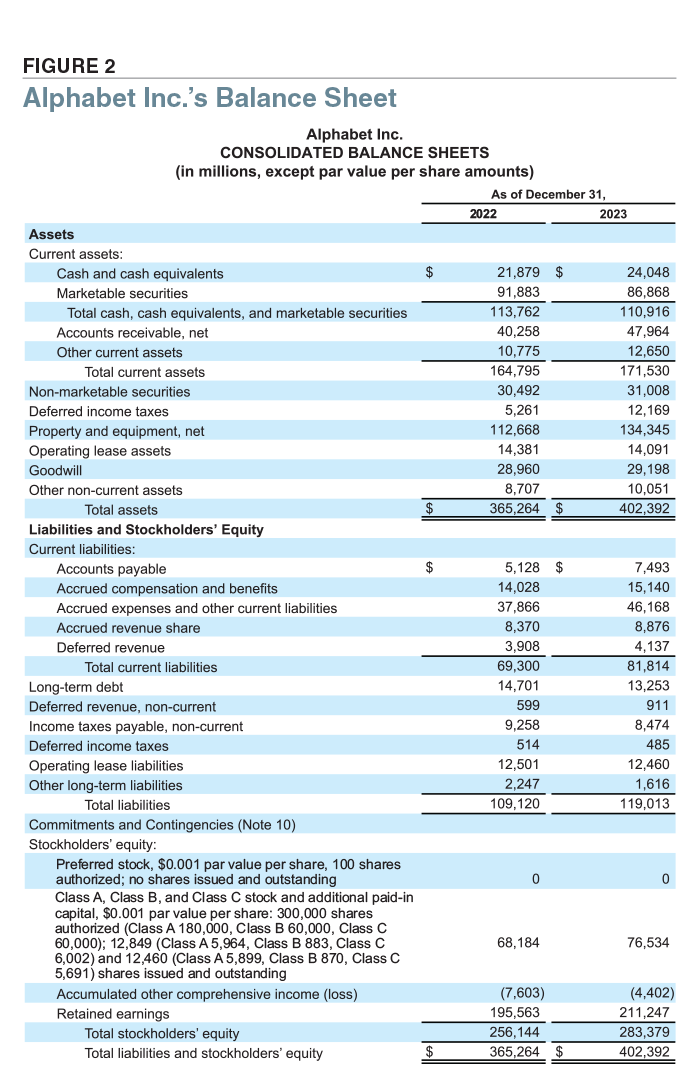
Alphabet does not pay dividends; however, it does repurchase stock. This shows up on its balance sheet as an increase in retained earnings.
Statement of Cash Flows
The third primary financial statement is the statement of cash flows. It shows how much money is flowing into and going out of the company. Cash is not the same as profits when it comes to financial reporting. Cash flow statements show the cumulative changes in cash flow rather than at a specific point in time.
There are three major elements of a cash flow statement: cash flow from operating activities, cash flow from investing activities and cash flow from financing activities.
Cash flow from operating activities encompasses the changes from a company’s day-to-day operations. The simplest example is cash coming in from the sale of a product, which would represent an increase in cash flows from operating activities. Offsetting this would be money spent to manufacture the product, pay employees and any other costs associated with normal business operations. All of these are decreases in cash from operating activities. Analysts are interested in cash flow from operations because it shows how much cash has been brought in or spent by a company through its core business operations.
Cash flow from investing activities covers investments purchased and sold. Investments can include purchases of property, plant and equipment. They also include long- and short-term investments in the equity and debt issued by other companies. Companies that are growing can have significant investing outflows as they invest cash into increasing operational capacity, particularly if they are in a more capital-intensive business such as manufacturing.
Companies invest in securities to earn higher interest income on excess cash or to hold a position in another company for business reasons. Alphabet has $86.8 billion of marketable securities listed under current assets on its balance sheet. The proceeds, or costs, associated with these marketable securities are detailed in the investing activities section of the cash flow statement.
Finally, cash flow from financing activities reports dollars received from obtaining capital or spent on repaying debt. Cash inflows from financing activities include the sale of stock and issuance of debt. Cash outflows include stock repurchases, dividends issued and the repayment of bonds or other long-term debt.
Investors keep a watchful eye on cash flow from financing for a variety of reasons. An increase in debt financing can add value for shareholders if profits are successfully generated from the borrowed capital. However, investors must be cautious when firms show significant increases in debt, as the cost of repaying this debt will impact profitability. A company buying back its own shares may indicate management’s willingness to return cash to shareholders or may signal management’s belief that its shares are undervalued.
Net free cash flow is the sum of the net cash flows from operations, investing and financing. This figure is the basis of numerous free cash flow valuation models, and analysts often use free cash flow as a basis to develop target prices for the company’s stock.
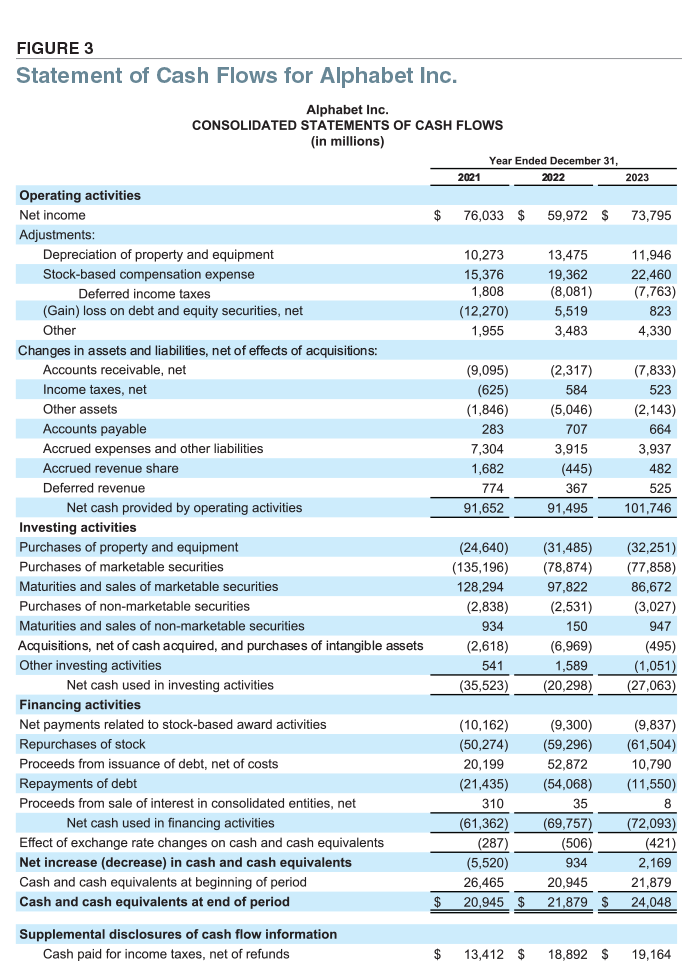
Alphabet’s statement of cash flows is presented in Figure 3. As you can see, Alphabet brought in $101.7 billion of cash from its operating activities in 2023. Total cash used in investing activities was $27 billion (outflows are shown as negative numbers). The company purchased property and equipment in addition to marketable securities. Alphabet also reported financing activities outflows. It repurchased $61.5 billion of stock, repaid $11.6 billion of debt and paid out $9.8 billion in stock awards to employees. Total cash increased by $2.2 billion for 2023, bringing total cash and cash equivalents at the end of the period to $24 billion.
The Links Between the Statements
Perhaps the best way to explain the link between the three financial statements is to show you a simplistic example of a firm’s operating activity. Let’s use Alphabet as an example.
Alphabet spent $32.3 billion on capital expenditures in 2023. These expenditures included servers, network equipment and data centers. The company also had $10 billion in revolving credit facilities as of the end 2023. These affect all three financial statements: the balance sheet, the income statement and the cash flow statement.
The purchase of servers and monies spent on data centers appear as equipment outflows on the investing activities section of the cash flow statement. To the extent Alphabet relied on its credit facilities to fund these purchases, the amounts would appear as inflows on the financing activities section of the statement.
Long-term assets listed on the balance sheet would increase by the reported value of the new equipment and data center expansions and renovations. (Alphabet’s property and equipment increased by nearly $21 billion in 2023.) Current and long-term liabilities will also increase by the amounts borrowed to pay for these purchases—offset by any repayment of outstanding debt.
Though Alphabet does not break out depreciation on its consolidated income statement, the $11.9 billion inflow listed for depreciation of property and equipment under cash from operating activities on the cash flow statement matches the expense recorded on the full-year income statement (provision for income taxes). Depreciation is a noncash charge and therefore gets added back to the income statement. We’ll explain this more in a future article in the series.
As you can see, all three of the major financial statements are linked together when one transaction is completed by a firm. It is vital to look at all three statements when establishing the financial health of a firm. The process is admittedly complex with many moving parts, and we will provide additional detailed examples in future articles.
How to Get Financial Statements
Financial statement data is available on a company’s website in the investor relations section. In addition, all AAII members can see summarized financial data on the Snapshot tab of AAII’s Stock Evaluator. To access it, type a company’s name or ticker symbol into the search box accessible on almost every page on AAII.com. (Click on the magnifying glass icon to open the search box.) A+ Investor and AAII Platinum subscribers can view seven years of a company’s financial statements on the Stock Evaluator (under the Financials tab).
A company’s earnings announcement press release reports the latest revenue and earnings numbers. Some earnings press releases will include an income statement, balance sheet and cash flow statement, while others will not. These press releases can be found by all AAII members in the News & Events section of AAII’s Stock Evaluator. The press releases are also available on each company’s website.
Companies file several forms with the SEC, including Form 10-K. Form 10-K is an annual report that gives a comprehensive overview, including all the company’s financial statements and financial disclosures. On a quarterly basis, companies are required to file Form 10-Q with the SEC. This interim filing only includes certain financial information, including unaudited financial statements. Annual 10-K and quarterly 10-Q filings can be found in the SEC’s EDGAR database at www.sec.gov/edgar (click on Search for Company Filings).
Other Information of Note
While we covered the three core financial statements used by individual investors and professionals alike, ancillary information is provided by companies that can be crucial to analyzing a stock.
The footnotes to the financial statements provide additional disclosures and explanations. Footnotes include significant accounting policies and practices, tax information, stock compensation breakdowns, contingencies, subsequent events following the time frame of reporting and more. Reading the footnotes will help you better understand management decisions, financial statement calculations or even “hidden” costs that are not accounted for on the main financial statements. We will dive further into footnotes and their impact as the series continues.
Another important source of information is the management discussion and analysis (MD&A). MD&A appears within a company’s annual report or financial statements and gives management’s narrative overview and comments on the company’s financial performance, position and future prospects. Typically, you’ll see an analysis of the operations, financial statement, risks and overall company performance by the company’s executives.
MD&A adds context and insights to the financial statements, creating a bridge between technical details of the financial statements and an understanding of the operations and strategy of a company.
Next in the Series
The next article in this Financial Statement Analysis series will show you how to best make use of a firm’s income statement. We will cover all the major line items as well as the key income statement figures in the May AAII Journal.
More at www.AAII.com/education
If you are new to stock investing and financial statement analysis, check out AAII’s Education Hub for these beginner resources:
Discussion
FREE REPORT

ROBERT A from NC posted over 2 years ago:
NICK B from TX posted over 2 years ago:
BARRY J from TX posted over 2 years ago:
You need to log in as a registered AAII user before commenting.
Log InCreate an account