



Related

AAII How-To
How small-cap mutual funds and ETFs can add diversification to your domestic stock investments.
Much attention has been given to the S&P 500 index rising above 5,000 and the performance of its Magnificent Seven stocks. The outperformance of this group of the largest technology-related stocks has led to a historically high level of concentration within the market-capitalization-weighted S&P 500. The index’s 10 largest stocks accounted for nearly one-third of the S&P 500’s total value.
So, what is an investor who wants domestic stock exposure of a different type to do? One option is to diversify by adding small-cap mutual funds and exchange-traded funds (ETFs).
The small-firm effect posits that smaller companies have higher risk-adjusted returns than larger companies. The long-term data supports this notion. Small-cap stocks have rewarded investors with an 11.8% return between 1926 through 2022 versus a 10.1% annualized return for large-cap stocks, according to Ibbotson’s 2023 SBBI Classic Yearbook. Furthermore, from 1926 through 2023, small-cap stocks outperformed large-cap stocks 56 times (or 57% of the time). Small-cap stocks have been more volatile, however, with a standard deviation of 31.0% versus 19.7% for the large-cap category. Some of this higher volatility is positive, caused by small-cap stocks’ larger gains.
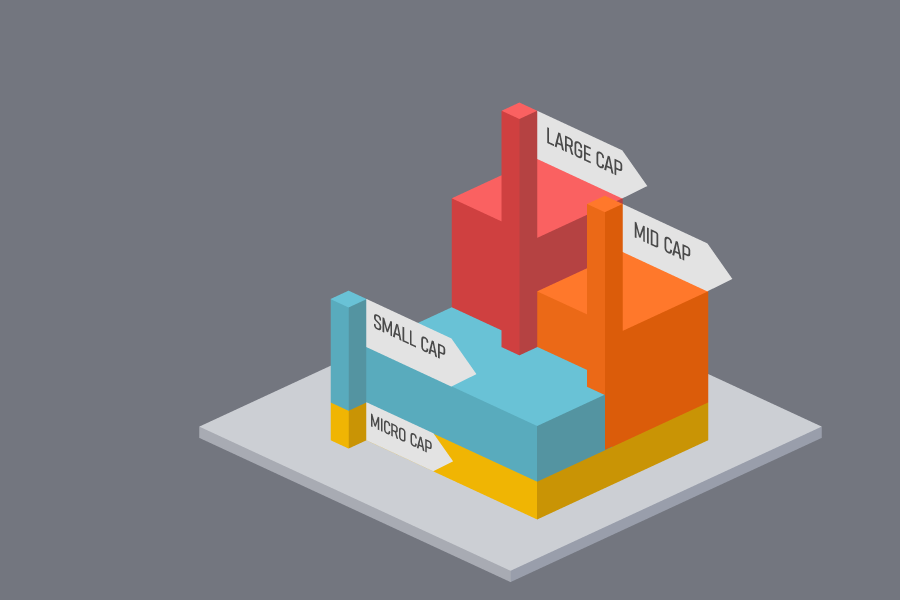
Market capitalization for small-cap stocks ranges between $600 million and $2 billion. Companies with market caps above $2 billion are either in the mid-cap or large-cap range. Below $600 million is the micro-cap range, which is sometimes thought of as a subset of the small-cap range.
In general, smaller companies can be nimbler than their larger brethren in terms of adjusting their business models. Small-cap stocks are less widely followed by analysts, less liquid and less frequently traded. Because of these factors, they are more prone to mispricing than large caps. Institutional investors often overlook small caps because these stocks may not have large enough size or volume of trades to allow fund managers to build a meaningful position and buy and sell holdings with ease.
There are several small-cap indexes that mutual funds and ETFs track. One of the most prominent is the Russell 2000 index. It is a subset of the Russell 3000 index and is composed of approximately 2,000 of the smallest stocks of that total-market index. Managers will also track the growth and value versions of the Russell 2000 depending on fund objectives. Other noteworthy small-cap indexes include the S&P SmallCap 600 index and the CRSP US Small Cap index. All are market-cap-weighted indexes.
As of January 31, 2024, the forward price-earnings (P/E) ratios of the S&P SmallCap 600 and Russell 2000 were 14.3 and 15.4, respectively. Both are considerably lower than the forward price-earnings ratio of 20.2 for the S&P 500, also measured on January 31. These relatively low price-earnings ratios for the indexes suggest that small-cap stocks could be poised to host their own party.
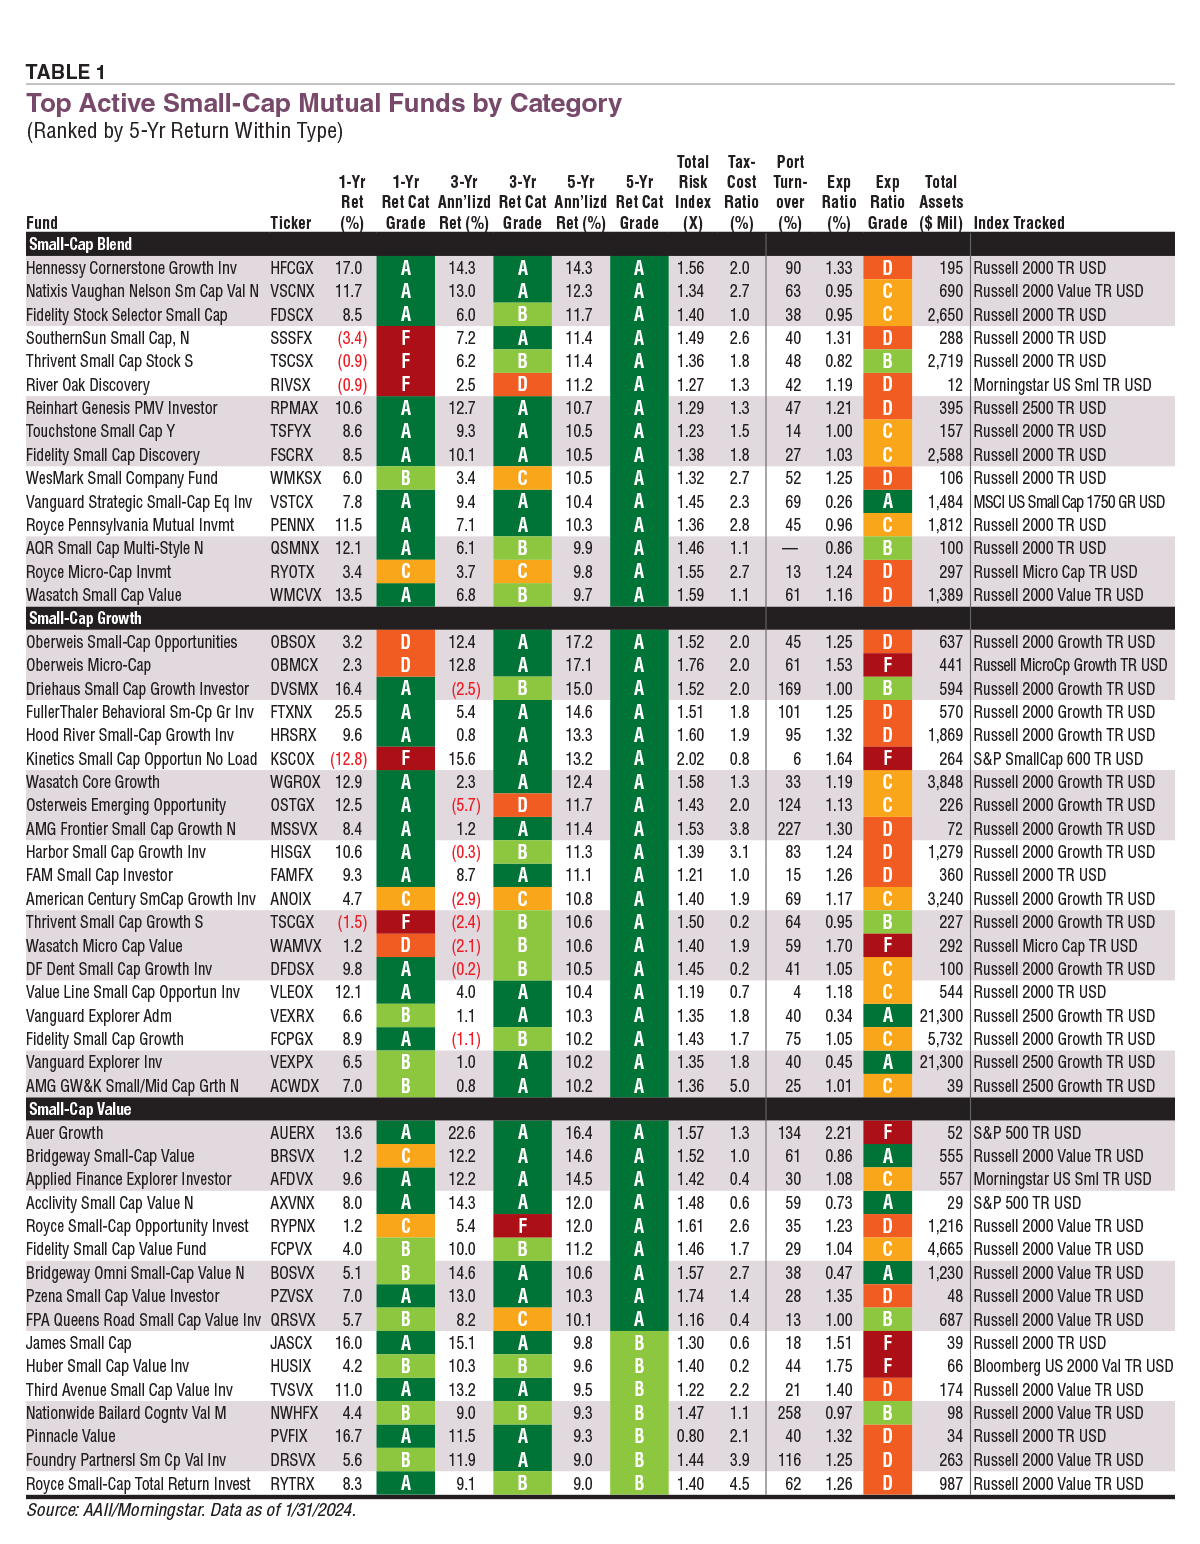
Traditionally, active managers have dominated the small-cap fund space. This is reflected in the universe used to create Table 1, which started with 142 actively managed small-cap mutual funds. To narrow down the list, we sorted the funds by highest five-year performance and grouped them by style. Because of illiquidity and risk, active management can add value to investing in small-cap stocks. After all, it is the portfolio manager’s job to steer the ship through smooth and rough waters by picking the most promising companies that offer potential for price appreciation.
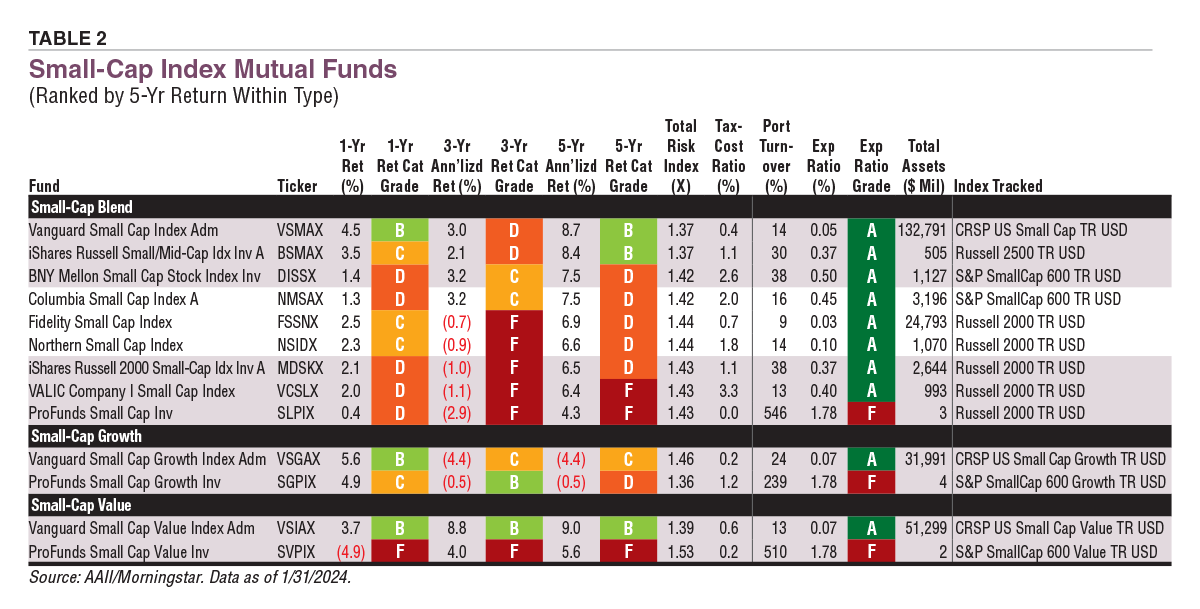
Many investors prefer an index fund. Table 2 shows small-cap index mutual funds. Small-cap ETFs are shown in Table 3. Most are index funds, but a few are actively managed.
To provide a complete picture, A+ Investor Grades are shown with all performance metrics. Mutual funds and ETFs lacking three- and five-year returns were excluded from the lists.
The Hennessy Cornerstone Growth Investor fund  (HFCGX) boasts the highest five-year annualized return of the small-cap blend funds shown in Table 1. Its performance compared to its peers over the past one-, three- and five-year periods earned the fund A+ Investor Grades of A.
Don’t be fooled by the name, it is a small-cap blend fund. This apparent style drift is a recurring theme we observed among small-cap funds.
Download the Excel spreadsheet for Table 1.
Hennessy Cornerstone Growth uses the Russell 2000 as its benchmark. The fund has taken big bets on industrials and energy, making it overweight in those sectors relative to the index. Its five-year annualized return of 14.3% beat the benchmark, which returned 6.8% for the same period.
Good performance isn’t cheap though: The expense ratio is 1.33% (a grade of D), the highest expense ratio of the small-cap blend funds shown in Table 1. For all active small-cap mutual funds, the average expense ratio is 1.12%.
Hennessy Cornerstone Growth also has a portfolio turnover rate of 90%. Putting this into context, the median portfolio turnover rate for all active small-cap funds is 43.6%. The highest turnover in Table 1 is 258% for the Nationwide Bailard Cognitive Value Fund Class M (NWHFX).
The Oberweis Small-Cap Opportunities fund (OBSOX) secured the top active small-cap growth spot with a 17.2% five-year annualized return. This return equates to an A+ Investor Grade of A. It’s a fund family affair: The Oberweis Micro-Cap fund (OBMCX) ranks second in this group with a 17.1% five-year annualized return. Over the same period, the Russell 2000 Growth index returned 6.2% and the Russell MicroCap Growth index returned 3.2%.
Once again, outperformance is pricey. These top two performers for the growth category have expense ratios of 1.25% and 1.53% for grades of D and F, respectively. This reflects higher-than-average costs compared to other funds in the same category.
Moving to small-cap value, you will notice that the top fund by five-year performance in Table 1 is the Auer Growth fund (AUERX). This also reflects style drift relative to the fund’s name (which is why you should read the fund’s fact sheet and prospectus). Its 16.4% five-year annualized return earned the fund an A+ Investor Grade of A. Auer Growth’s expense ratio of 2.21% earned it a grade of F, however. The fund’s benchmark is the S&P 500 even though it is classified as a small-cap fund by Morningstar.
Expense ratios for the active small-cap mutual funds run the gamut with the majority being significantly greater than 1.0%. Vanguard funds had the lowest expense ratios among the active small-cap funds shown in Table 1. The Vanguard Strategic Small-Cap Equity fund (VSTCX) has an expense ratio of 0.26%, which equates to an A+ Investor Grade of A.
We’ve already pointed out examples of style drift. The companies comprising this Vanguard fund’s portfolio have a median market cap of $3.2 billion, outside the $2 billion upper range for small caps.
Tax-cost ratios tend to be high for this group. The median tax-cost ratio for the active group is 1.9% compared to 1.1% for the index mutual funds in Table 2.
Download the Excel spreadsheet for Table 2.
There are only 13 small-cap index mutual funds. Funds in this group have much lower expense ratios, with the majority boasting an A+ Investor Grade of A for expense ratio. The exceptions are three funds from ProFunds, which charge a 1.78% expense ratio. The funds didn’t perform very well either, with five-year return grades of F and D. Portfolio turnover in these funds has been closer to that of active funds at 546%, 239% and 510%.
The Vanguard Small Cap Index Admiral fund (VSMAX) in the small-cap blend group and the Vanguard Small Cap Value Index Admiral fund (VSIAX) in the small-cap value group had the highest five-year annualized returns among index mutual funds. Each earned an A+ Investor Grade of B for five-year returns of 8.7% and 9.0%, respectively. Vanguard keeps a lid on expenses, charging 0.07% or less for its small-cap index funds.
Notably, none of the small-cap index mutual funds received a single A+ Investor Grade of A for their returns over any of the periods shown. The most common grade was D followed by F.
Active management may have helped the small-cap growth category, as the funds in this group in Table 1 all earned A+ Investor Grades of A for five-year annualized returns. In contrast, the two small-cap growth index funds in Table 2—Vanguard Small Cap Growth Index Admiral fund (VSGAX) and ProFunds Small Cap Growth fund (SGPIX)—both had negative returns over the same period.
Investors might expect volatility to be lower in index funds. This was not the case. The median total risk index for the index funds is 1.43 compared to 1.40 for the active funds. The total risk index compares a given fund’s volatility with that of all funds in the universe. The average risk index is 1.00. A value above/below 1.00 indicates higher/lower risk relative to the overall universe.
A quick look at Table 3 shows that expense ratios for small-cap ETFs are fairly mixed, with mostly A+ Investor Grades of B and C. The average expense ratio for all small-cap ETFs is 0.32%. The median total risk index is the same as that for the index mutual funds, 1.43—reflecting the higher volatility of small-cap stocks. Unsurprisingly, the median tax-cost ratio of 0.5% is much lower than that for either the active or index mutual funds. Vanguard and iShares offer ETFs with the lowest expense ratios in this space. Vanguard, iShares and Schwab also represent the lion’s share of assets.
Download the Excel spreadsheet for Table 3.
The Invesco S&P MidCap 400 GARP ETF (GRPM) is the highest-performing small-cap blend ETF with an 11.0% annualized return over five years. (Again, notice the category drift relative to the name.) This five-year return earned the ETF an A+ Investor Grade of A. Invesco S&P MidCap 400 GARP was also among the top performers within its category for the past one and three years, with returns of 7.5% and 9.0%, respectively. The expense ratio of 0.35% is near the average for the group, as reflected by the A+ Investor Grade of C.
The ALPS O’Shares US Small-Cap Quality Dividend ETF (OUSM) ranks second in terms of performance with five-, three- and one-year annualized returns of 10.8%, 10.0% and 8.0%, respectively. Unfortunately, the ETF’s expense ratio is a comparatively high 0.48%, equivalent to a grade of D.
Actively managed ETFs have increased in number during the past several years. Seven active small-cap ETFs are included in Table 3. The Dimensional US Small Cap ETF (DFAS) has $7.2 billion in assets. This active small-cap blend ETF charges a 0.26% expense ratio, equivalent to an A+ Investor Grade of C. The five-year annualized 9.2% return earned a grade of A, however.
The Invesco Dorsey Wright SmallCap Momentum ETF (DWAS) sits in the top small-cap growth spot with a five-year annualized return of 12.2%. The expense ratio of 0.60% is above average, as can be seen by the D grade. It also has the highest turnover rate of the small-cap ETFs in Table 3 at 181%. The three- and one-year annualized returns of 1.8% and 9.2%, respectively, were comparatively good, earning A+ Investor Grades of A and B.
Invesco also nabbed the second-place spot for small-cap growth ETFs. The Invesco S&P SmallCap Momentum ETF (XSMO) has five-, three- and one-year annualized returns of 11.0%, 4.5% and 13.8%. The expense ratio of 0.39% is about average.
The Invesco WilderHill Clean Energy ETF (PBW) has the highest total risk index in Table 3 at 2.87. This is double the median for all small-cap ETFs of 1.43. This small-cap growth index ETF has had wild swings in annual returns and shows A+ Investor Grades of F for the three performance periods depicted.
The Pacer US Small Cap Cash Cows 100 ETF (CALF) commands the top spot in the small-cap value category. It has realized five-, three- and one-year returns of 14.6%, 13.0% and 20.2, corresponding with A grades for the three periods. The expense ratio of 0.59% is high for a small-cap value ETF.
Even in this group, we see style drift relative to an ETF’s name. The Invesco S&P MidCap Value with Momentum ETF (XMVM) is categorized as a small-cap value ETF.
There is a popular saying among those in the ETF industry: “There is an ETF for everything.” To that point, some of the small-cap ETFs provide exposure to investment factors beyond growth and value. For example, the Invesco S&P SmallCap Momentum ETF (XSMO) combines momentum and growth. Investors should be aware that ETFs focused on multiple factors could be viewed as more niche products and may not attract as many assets as ETFs following less complex strategies.
Returns for these mutual funds and ETFs can be choppy. It is not uncommon to see a swing of +/– 10% over a five-year period. Underperformance can persist for long periods. Therefore, five key considerations should be used as a checklist when investing in a small-cap fund. This is especially pertinent when selecting funds from the active space.
Here is the simple checklist you can use:
1. Think long-term for your investment horizon.
2. Keep an eye on management risk.
3. Consider the level of exposure you want.
4. Keep an eye out for style drift relative to a fund’s name.
5. Beware of high portfolio turnover.
You can research funds further at AAII.com. Data for more than 23,000 mutual funds and 3,400 ETFs is updated monthly and available to all AAII members. To access our fund guides, screens of top performers, comparison tools and more, visit www.aaii.com/funds and www.aaii.com/etfs.
AAII How-To

ETFs and Mutual Funds


JIM L from MI posted over 2 years ago:
You need to log in as a registered AAII user before commenting.
Log InCreate an account