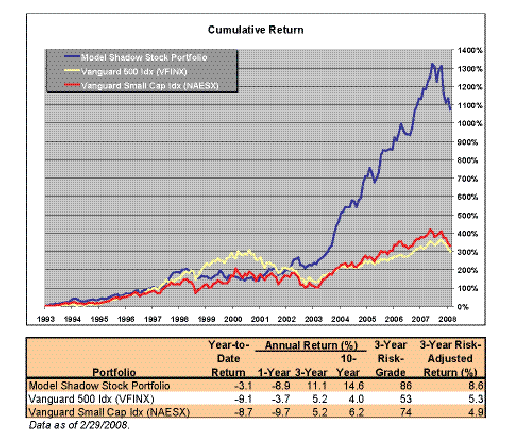
The market weakness continues, but it has stopped hitting small-cap and value stocks more than the general market. In fact, the Model Shadow Stock Portfolio is now performing better than the overall market, with a year-to-date return of –3.1% versus –9.1% for the Vanguard S&P; 500 Index Fund (VFINX) and –8.7% for the Vanguard Small Cap Index (NAESX), as of the end of February.
At the end of November we thought the Model Shadow Stock Portfolio would finish in the black for the year, but December proved very weak and it in fact finished 2007 in negative territory, down 1.8%.
Figure 1 provides returns for various cumulative periods for the portfolio and comparative indexes. The results for the entire history of the Model Shadow Stock Portfolio are presented in Table 1.
Figure 1.
Model Shadow Stock
Portfolio vs. Benchmarks
(Through 2/29/08)
|
|
CLICK ON IMAGE TO
SEE FULL SIZE.
|
|
Model Portfolio vs. Newsletters
Last year we started to examine, on an annual basis, the performance of the Model Shadow Stock Portfolio compared to the formal advisory services covered in the Hulbert Financial Digest.
This year, we are able to draw comparisons based on a full 15-year period. The results for absolute return are shown in Table 2.
If the Hulbert Financial Digest ranked the Model Shadow Stock Portfolio in terms of return performance, it would have been the No. 2 performer over the entire 15 years, the No. 4 performer over the last 10 years, and the No. 4 performer for the last five years.
While we can’t duplicate Hulbert’s method of risk adjustment, the Model Shadow Stock Portfolio’s risk level is lower than most of the top five advisory newsletters for each period, so the Model Shadow Stock Portfolio would have ranked even higher relative to the other newsletters on a risk-adjusted basis.
| Table 2. The Model Shadow Stock Portfolio vs. Advisor Newsletters
|
| Last 5 Years |
Annual Return
(%) |
| Shadow Stock Portfolio |
30.1 |
| DJ Wilshire 5000 Index |
13.8 |
| Hulbert Financial Digest Top Newsletter* |
38.8 |
| Last 10 Years |
Annual Return
(%) |
| Shadow Stock Portfolio |
15.5 |
| DJ Wilshire 5000 Index |
6.2 |
| Hulbert Financial Digest Top Newsletter* |
18.1 |
| Last 15 Years |
Annual Return
(%) |
| Shadow Stock Portfolio |
18.1 |
| DJ Wilshire 5000 Index |
10.3 |
| Hulbert Financial Digest Top Newsletter* |
21.7 |
* Newsletter with the highest return for the indicated period.
Data as of 12/31/2007. |
Quarterly Portfolio Activity
Table 3 highlights activity in the portfolio during the three months ending February 29, 2008. Table 4 shows the current holdings and their status as of March 7, 2008.
We continue to find new qualifying stocks and have sold McRae Industries (MRINA), the last of our two-year-rule stocks (the stock has not met the buy criteria for over two years), to free up funds for new purchases. We also sold Gottschalks Inc. (GOT) because it violated the terms of earnings probation by having another quarter of negative earnings.
The three new stocks added to the portfolio are: AeroCentury Corp. (ACY), Alloy Inc. (ALOY), and SureWest Communications (SURW).
| Table 3. First-Quarter 2008 Transactions
|
| Company (Ticker) |
Reason |
| Sell |
| Gottschalks Inc. (GOT) |
negative earnings |
| McRae Industries (MRINA) |
two-year rule |
| Buy |
| AeroCentury Corp. (ACY) |
|
| Alloy, Inc. (ALOY) |
|
| SureWest Communications (SURW) |
|
The Markets and the Election
As I pointed out in my January Model Portfolios column, presidential election years tend to be average years for the stock market (with an average return of 12.9%). However, if the economy does swing into an economic recession, the market will likely go even lower.
Even if economic growth picks up next quarter, it may take awhile for the stock market to approach old highs—even though it looks like a bargain at current levels.
I am a bit distressed by the election speeches advocating tax increases, particularly raising capital gains tax rates. I hope any such notions will at least wait for a stronger economy.
We will update the performance of the Model Shadow Stock Portfolio in the July AAII Journal, or you can follow it at AAII.com.
In the meantime, try to maintain a long-term perspective. These are the times that test our ability to cope with risk.





No comments have been added yet. Add your thoughts to the discussion!
You need to log in as a registered AAII user before commenting.
Log InCreate an account