


Wayne Thorp leads a class in AAII's new Essential Investing Video Course. Go to https://www.aaii.com/ves for more information and to subscribe.
If you invest in mutual funds—whether you are just starting out or are looking to make changes to your portfolio—understanding a fund’s tax efficiency could save you money in the long run.
Here we show how you can gauge the tax-friendliness of a mutual fund you own or are considering.
Taxes on Mutual Funds
Mutual fund investors are at a disadvantage compared to stock investors when it comes to taxes.
Stock investors pay taxes on an investment only if they have pocketed dividends or income or have sold stocks for a profit. This means stock investors have a significant level of control over when they have to pay taxes.
But investors of traditional mutual funds can face a tax bill even if they haven’t sold any of their holdings or if they’ve lost money since investing in the fund.
Like all investors, mutual fund holders have to pay taxes on dividends from stocks and interest from bonds. However, they also have to pay taxes on fund distributions. A distribution generally refers to the disbursement of assets from a fund to an investor. Mutual fund distributions consist of net capital gains made from the profitable sale of portfolio assets, along with dividend income and interest earned by those assets. Investors must pay taxes on those distributions during the year they were received. Mutual funds tend to be tax-inefficient from the standpoint that investors do not have control of when a fund manager sells portfolio assets.
ETF Versus Mutual Fund Tax Efficiency
There is also a difference in tax treatment between open-ended mutual funds and exchange-traded funds (ETFs). ETFs can be more tax-efficient compared to traditional mutual funds. Generally, holding an ETF in a taxable account will generate less tax liabilities than if you held a similarly structured mutual fund in the same account.
From the perspective of the IRS, the tax treatment of ETFs and mutual funds are the same. Both are subject to capital gains tax and taxation of dividend income. However, ETFs are structured in such a manner that taxes are minimized for the holder of the ETF, and the ultimate tax bill—after the ETF is sold and capital gains tax is incurred—can be less than what the investor would have paid with a similarly structured mutual fund.
In essence, there are fewer (and often smaller) “taxable events” in a conventional ETF structure than in a mutual fund.
A mutual fund manager must constantly rebalance the fund by selling securities to accommodate shareholder redemptions or reallocate assets. The sale of securities within the mutual fund portfolio creates capital gains for the shareholders, even for shareholders who may have an unrealized loss on the overall mutual fund investment.
In contrast, an ETF manager accommodates investment inflows and outflows by creating or redeeming “creation units,” which are baskets of assets that approximate the entirety of the ETF investment exposure. As a result, the investor usually is not exposed to capital gains on any individual security in the underlying structure.
However, it’s worth pointing out that mutual fund managers take advantage of carrying capital losses over from prior years, tax-loss harvesting and other tax mitigation strategies to diminish the impact of annual capital gains taxes.
What Can Portfolio Turnover Tell You?
A fund’s portfolio turnover rate is the lower of purchases or sales divided by average net assets. It reflects how frequently securities are bought and sold by the fund.
High turnover can be a signal that a fund may not be tax-efficient. Index mutual funds are far more tax-efficient than actively managed funds because of lower turnover.
What Is the Tax-Cost Ratio?
Another useful metric is the tax-cost ratio, which measures how much of a fund’s annualized return is reduced by investors’ taxes on distributions.
Think of the tax-cost ratio as you would an expense ratio. Like an expense ratio, the tax-cost ratio is a measure of how one factor can negatively impact performance. The lower the tax-cost ratio, the lower the tax impact if you hold the fund in a taxable account. Like an expense ratio, it is usually concentrated in the range of 0% to 5%. Zero percent indicates that the fund had no taxable distributions, and 5% indicates that it was less tax-efficient.
For example, if a fund had a 2% tax-cost ratio for a three-year time period, it means that each year investors in that fund lost 2% of their assets to taxes on average. If the fund had a three-year annualized pretax return of 10%, an investor in the fund took home about 8% on an aftertax basis.
This is not to say that you should automatically buy a fund because its tax-cost ratio is low or zero. Many good funds pay out distributions, so you shouldn’t necessarily avoid a fund just because it has a tax-cost ratio greater than 0%. However, you may wish to hold funds with high tax-cost ratios in nontaxable accounts, such as 401(k)s and IRAs.
Resources for Gauging Fund Tax Efficiency
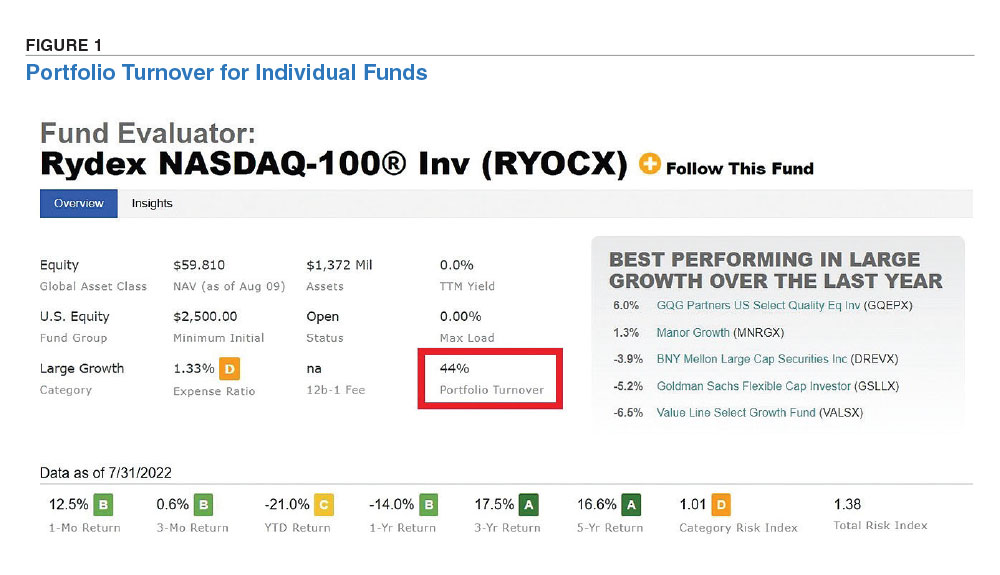
AAII members can check the turnover rate and tax-cost ratio for any mutual fund by typing the fund name or ticker in the Search box and selecting the fund from the drop-down box. Figure 1 shows the portfolio turnover listed in the summary data at the top of the Fund Evaluator page. Also, at the online Guide to Mutual Funds, you can sort a category of funds by turnover rate or tax-cost ratio. Fund Guide data is updated monthly.
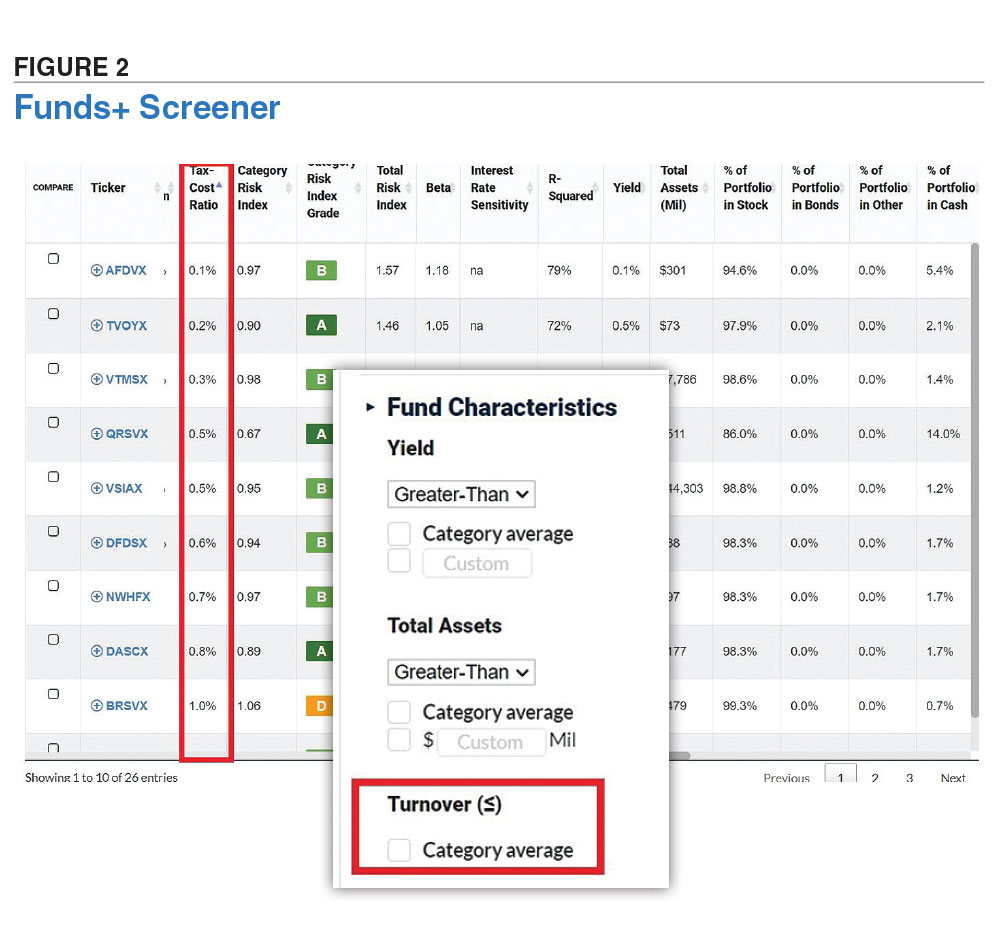
A+ Investor subscribers can use the Funds+ Screener to isolate funds with turnover rates at or below their category average. Figure 2 shows the results of loading the predefined Small Caps Performing Well Compared to Peers screen and then adding a filter for turnover. Ten of the 26 funds that passed the screen have turnover equal to or lower than the small-cap category average. You can then sort the list based on tax-cost ratio or export it for further analysis. Screener data is also updated monthly.

Related

Portfolio Strategies
Minimizing Taxes With Asset Allocation
Related

Beginning Investor
The Tax Consequences of Investing
Discussion
FREE REPORT

Get your free copy of our special
report analyzing the tech stocks
most likely to outperform the
market.
No comments have been added yet. Add your thoughts to the discussion!
You need to log in as a registered AAII user before commenting.
Log InCreate an account