



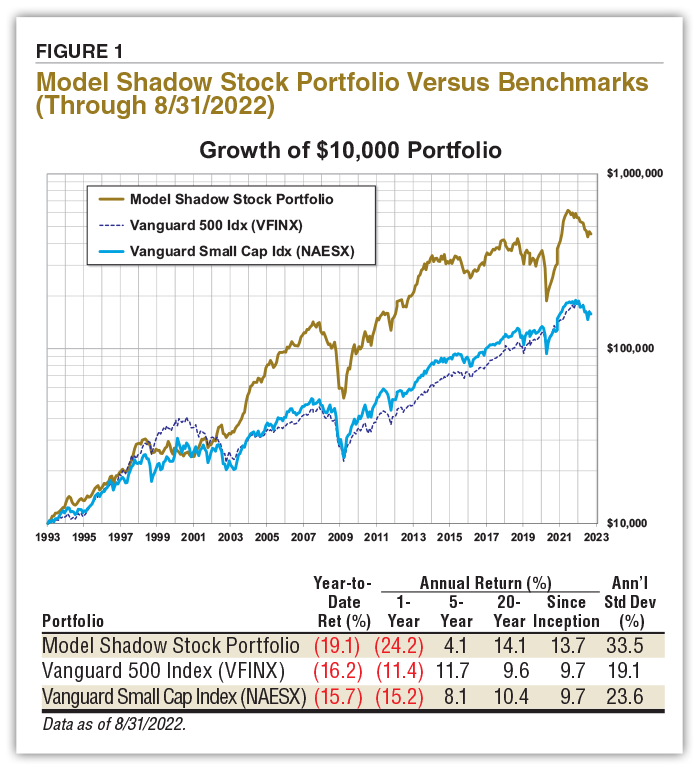
A hawkish tone from Federal Reserve chair Jerome Powell helped to fuel a stock sell-off in August, which impacted the Model Shadow Stock Portfolio’s performance. Investors considered a greater likelihood of economic slowdown as the Fed seeks to rein in inflation. The Model Shadow Stock Portfolio lost 2.8% during August 2022 and is now down 19.1% for the year. The S&P 500 index as measured by the performance the Vanguard 500 Index fund  (VFINX) had a loss of 4.1% during August and is down 16.2% for the first eight months of the year. The Vanguard Small Cap Index fund (NAESX) is down 15.7% for the year after shedding 2.6% in August.
Since its inception in 1993, the AAII Model Shadow Stock Portfolio has a compound annual average return of 13.7% versus the Vanguard 500 Index fund’s gain of 9.7% per year on average over the same period. The Vanguard Small Cap Index fund also posted an average annual gain of 9.7% for this period. Figure 1 shows historical returns over various periods.
Profitability and Stock Performance
While the market has been weak recently, some market and industry sectors have performed better than others. The top portion of Figure 2 examines the constituents of the S&P market-capitalization groupings, as well as the current Model Shadow Stock Portfolio and all stocks. The lower portion of the table examines the exchange-listed constituents of the 11 sectors used by Refinitiv to provide broad industry groupings. Each section is ranked by the median performance over the last 52 weeks of the stocks that make up each index or sector.
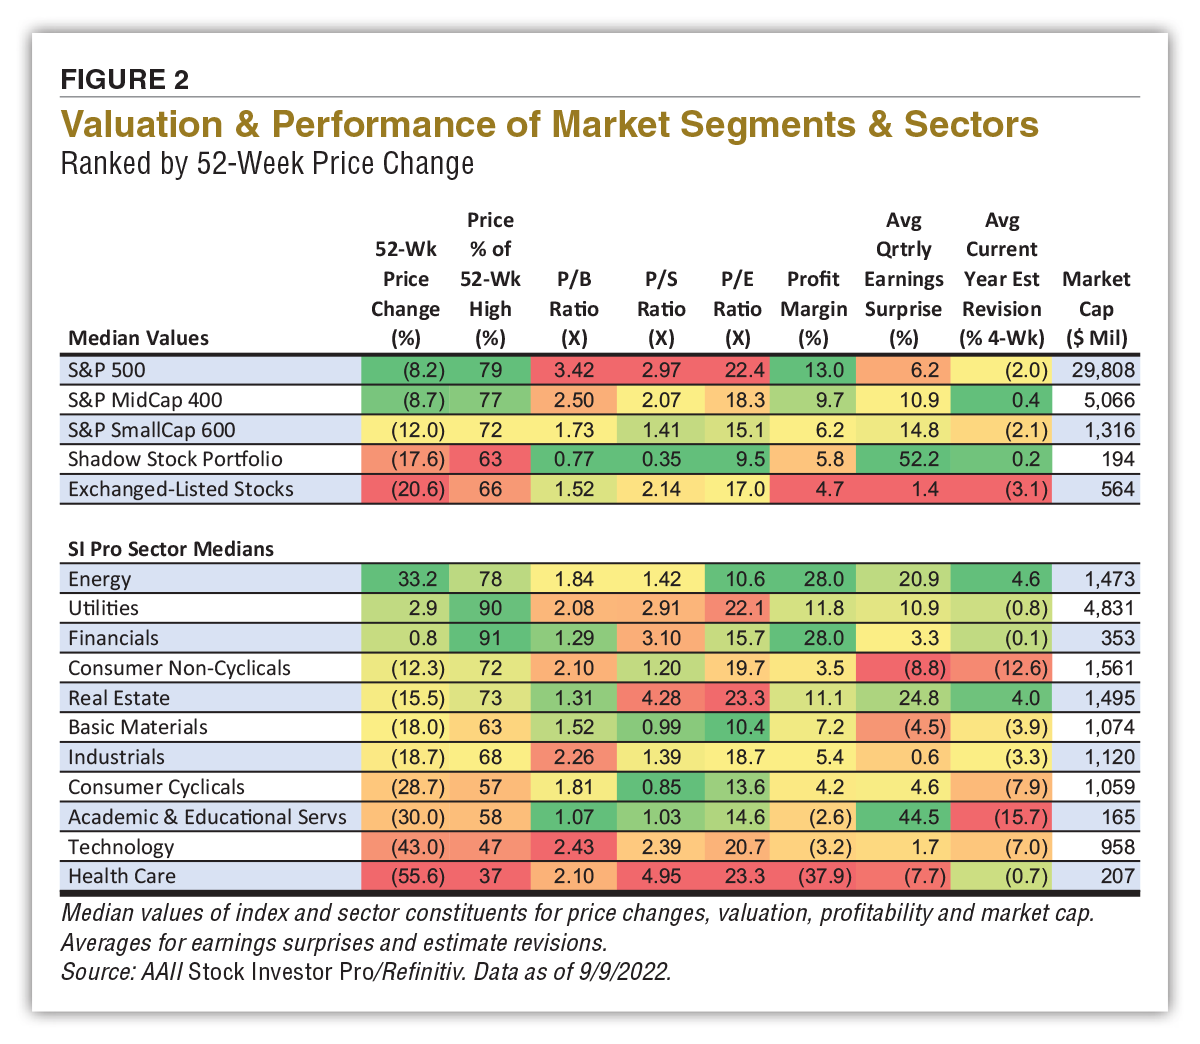
The typical stock is down over the last 52 weeks, but larger companies have fared better than smaller companies. The median price change for the stocks that make up the S&P 500 is down 8.2% over the last year. In contrast, the constituents of the S&P SmallCap 600 index are down 12.0% over the last year. The stocks in the Model Shadow Stock Portfolio are down 17.6% over the last 52 weeks—closer to the level for all exchange-listed stocks, which are down 20.6%.
Larger companies are trading with significantly higher valuations or multiples of book value, sales or earnings compared to smaller-cap stocks. The median price-earnings (P/E) ratio is 22.4 for the stocks in the S&P 500 compared to 15.1 for stocks in the S&P SmallCap 600 and 9.5 for stocks in the Model Shadow Stock Portfolio. Stocks normally trade with higher price-earnings ratios if investors anticipate higher future earnings growth as well as lower risk of achieving growth.
Profit margin (net income divided by revenue) relates the ability of a company to convert top-line sales into bottom-line earnings. If earnings drive stock prices, stock prices will go up as revenue increases, more of that revenue is converted into earnings and investors are willing to pay a greater multiple for a given level of earnings. The table confirms a strong connection between recent profitability and price strength. With the economic uncertainty, investors have emphasized investing in companies with high quality of earnings and greater financial strength. It is also interesting that while smaller companies had stronger positive earnings surprises than larger companies last quarter, the positive surprises did not translate to better stock price performance.
That preference for companies with greater profitability and stability can also be seen within the sector groupings. Only the companies in the energy, utility and financial sectors showed price increases over the last 52 weeks. The stocks in the health care sector had the weakest performance, down 55.6% over the last year.
As a group, the health care sector consists of many small companies ($207 million median market cap) that have been very unprofitable recently (net profit margin of negative 37.9%). Yet the stocks in the group have among the highest valuations (median price-earnings ratio of 23.3 times trailing earnings). The stocks in the health care sector also have some of the largest average negative earnings surprises (averaging negative 7.7% last quarter). The poor recent fundamental performance may help to explain the recent weak stock performance. But keep in mind that we have seen the weakest-performing sector one year become the best-performing sector in the next year, if the factors hurting their fundamental performance change.
Quarterly Review
The Model Shadow Stock Portfolio undergoes a quarterly review, which is tied to the reporting cycle of most domestic publicly traded firms. Holdings are examined to see if they have violated the size, valuation, profitability and age rules of the Model Shadow Stock Portfolio.
The review begins with an examination of the breakpoints for the smallest and cheapest deciles of domestically listed stocks. The primary Model Shadow Stock Portfolio selection criteria target the intersection of the smallest 10% of domestic stocks as measured by market cap, along with the “cheapest” 10% of domestic stocks as measured by the price-to-book-value (P/B) ratio. These decile breakpoints are determined by examining domestic companies that are listed on the New York Stock Exchange (NYSE) and then applying the size and value breakpoints for stocks listed on all domestic exchanges.
Rule Change
The price-to-book cutoff has decreased slightly from 0.89 in June to 0.88. With the current initial qualifying maximum price-to-book ratio at 0.90, we are leaving it unchanged. Qualifying stocks must have a price-to-book ratio of 0.90 or lower. Stocks in the model portfolio are sold for valuation if they exceed three times the minimum initial price-to-book ratio at the time of a quarterly portfolio review.
We then examined market-cap levels of the companies listed on the NYSE to determine the size cutoff for the lowest decile. Here the market-cap level maximum was $330 million, compared to $383 million in June 2022. With the current initial qualifying market-cap level at $400 million for the portfolio, we are reducing the maximum initial market cap value to $350 million. Holdings are sold if their market cap goes above three times the initial criterion at the time of the quarterly review: $1.05 billion.
The other major factor that leads to portfolio turnover is tied to negative earnings. If a company reports trailing 12-month earnings from continuing operations that are negative, the stock is placed on probation; if a subsequent quarter has negative earnings prior to trailing 12-month earnings becoming positive, the stock is sold.
The detailed Model Shadow Stock Portfolio purchase and sell rules, along with portfolio management tips, are available online (www.aaii.com/model-portfolios/stock-rules).
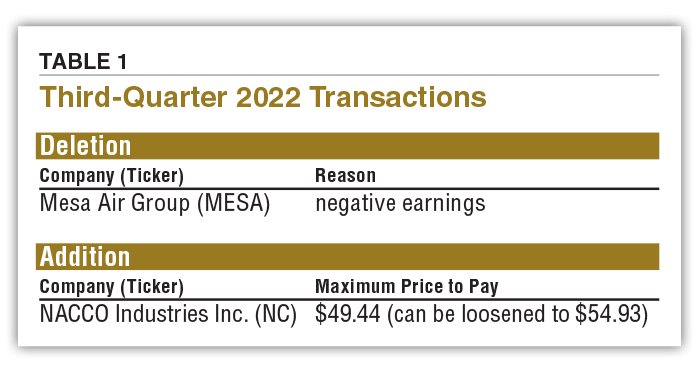
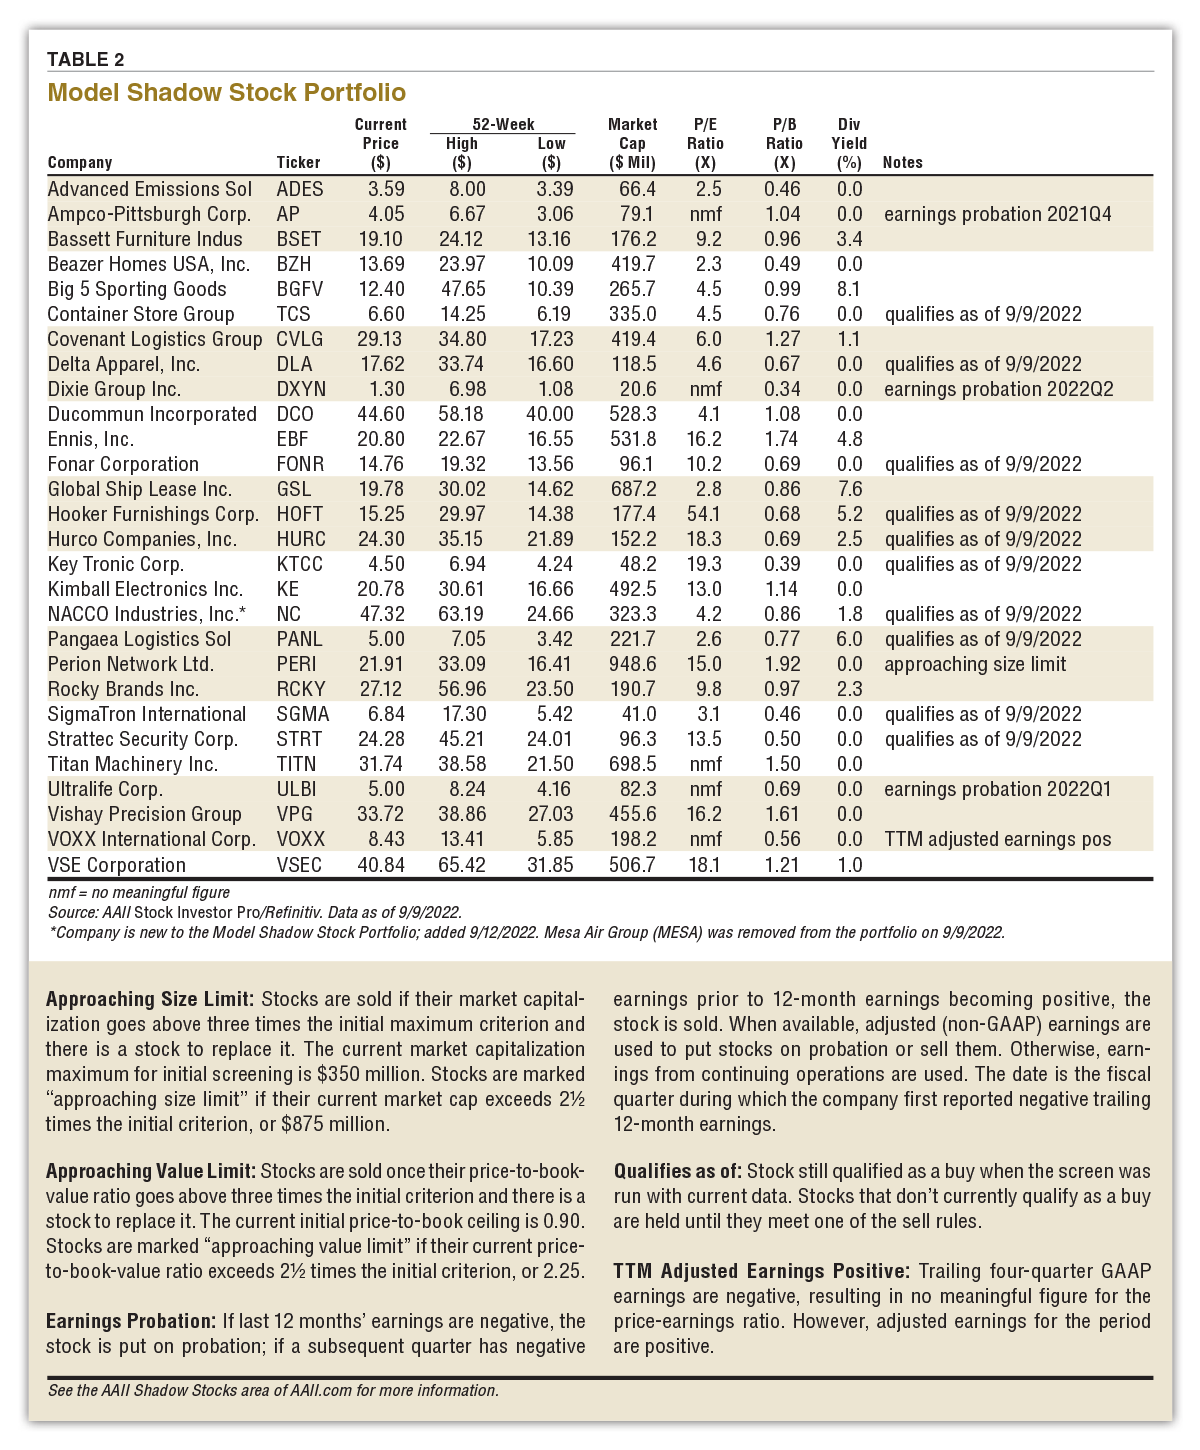
After conducting the quarterly review of the Model Shadow Stock Portfolio at the beginning of September, Mesa Air Group was removed from the tracking portfolio during regular trading hours on Monday, September 12. With the proceeds from the sale, as well as the cash held in the portfolio, there were enough funds to purchase one new holding at a level roughly matching the average position—NACCO Industries Inc. (NC). Table 1 summarizes the changes. Table 2 shows the current holdings in the Model Shadow Stock Portfolio.
Deletion: Mesa Air Group (MESA)
Mesa Air Group is the holding company of Mesa Airlines, a regional air carrier providing passenger and cargo service as either American Eagle, United Express or DHL Express.
Mesa Air Group was removed from the portfolio because of the Model Shadow Stock Portfolio’s negative earnings rule. Mesa Air Group reported an adjusted earnings loss of $0.20 per share, while trailing adjusted earnings per share remained in the red.
Addition: NACCO Industries, Inc. (NC)
As of September 9, 35 stocks met the initial selection criteria for the Model Shadow Stock Portfolio. This is up from 28 passing companies last month, even after tightening the maximum market-cap level from $400 million to $350 million.
Nine stocks already in the Model Shadow Stock Portfolio passed the updated criteria at the time of the review. The remaining 26 stocks were examined to ensure adequate liquidity, timely financial filings and appropriate industry and foreign considerations, which eliminated 11 stocks from consideration. The Shadow Stock Portfolio Rules on AAII.com provide guidance on factors to consider when selecting stocks for your portfolio.
Price momentum is used as the tiebreaker among qualifying stocks. The remaining 15 stocks were ranked using the weighted relative strength ranking, which considers price performance over the last year but places a higher weight on the most recent quarterly price performance.
NACCO Industries is a holding company operating through three business segments: coal mining, North American Mining and minerals management. The coal mining segment operates surface coal mines for power generation companies and an activated carbon producer. The North American Mining segment is a mining partner for producers of aggregates, lithium and other minerals. The minerals management segment acquires and promotes the development of mineral interests. The company also provides stream and wetland mitigation solutions.
NACCO Industries has a book value per share of $54.93 as of June 30. If you wish to stay within the 0.90 price-to-book-value maximum, you should pay no more than $49.44 per share ($54.93 (NAESX) 0.90). However, if the stock price has moved up after being added to the portfolio, you can still purchase the stock unless the price-to-book ratio goes above 1.00, which equates to a price of $54.93 per share. To calculate the maximum purchase price based on the maximum desired price-to-book ratio, multiply the current book value per share ($54.93 for NACCO Industries) by the maximum price-to-book ratio to be considered for the Model Shadow Stock Portfolio (currently 0.90, or 1.00 for loosened consideration).
Next Portfolio Review
The next quarterly review of the Model Shadow Stock Portfolio will take place following the end of November 2022. Any changes to the portfolio will be announced at the time they are made in our Model Shadow Stock Portfolio Update emails (sign up at www.aaii.com/email).
Discussion
FREE REPORT

No comments have been added yet. Add your thoughts to the discussion!
You need to log in as a registered AAII user before commenting.
Log InCreate an account