



There is probably little cause for joy initially in reviewing the third-quarter performance results for exchange-traded funds (ETFs) and mutual funds across most asset types. Perhaps hope existed at the beginning of 2022 that economic conditions would even out as the effects of the pandemic began to fade domestically, but any relief over the economy adapting to the pandemic was squashed by soaring inflation and geopolitical events, prominently Russia’s invasion of Ukraine.
With the close of the third quarter, the S&P 500 index marked its third-worst performance since the 1950s.
For the U.S. Federal Reserve, to slow inflation is to slow economic growth, and this also ripples across the globe. This year, the Fed has raised interest rates five times for a total increase of 300 basis points (bps), or 3.0%. Another 125 bps, or 1.25%, is expected by the end of the year.
The 50 most widely held no-load mutual funds all posted negative returns for the third quarter. The Vanguard Total Stock Market Index fund  (VTSAX), with assets of over $1 trillion, was down by 4.5%, as an example of a large-blend category fund representing the U.S. equity market. The Vanguard Total International Stock Index fund (VTIAX)—the third-most widely held no-load mutual fund—was down by 10.5%, as an example of a foreign large-blend category fund representing global investments.
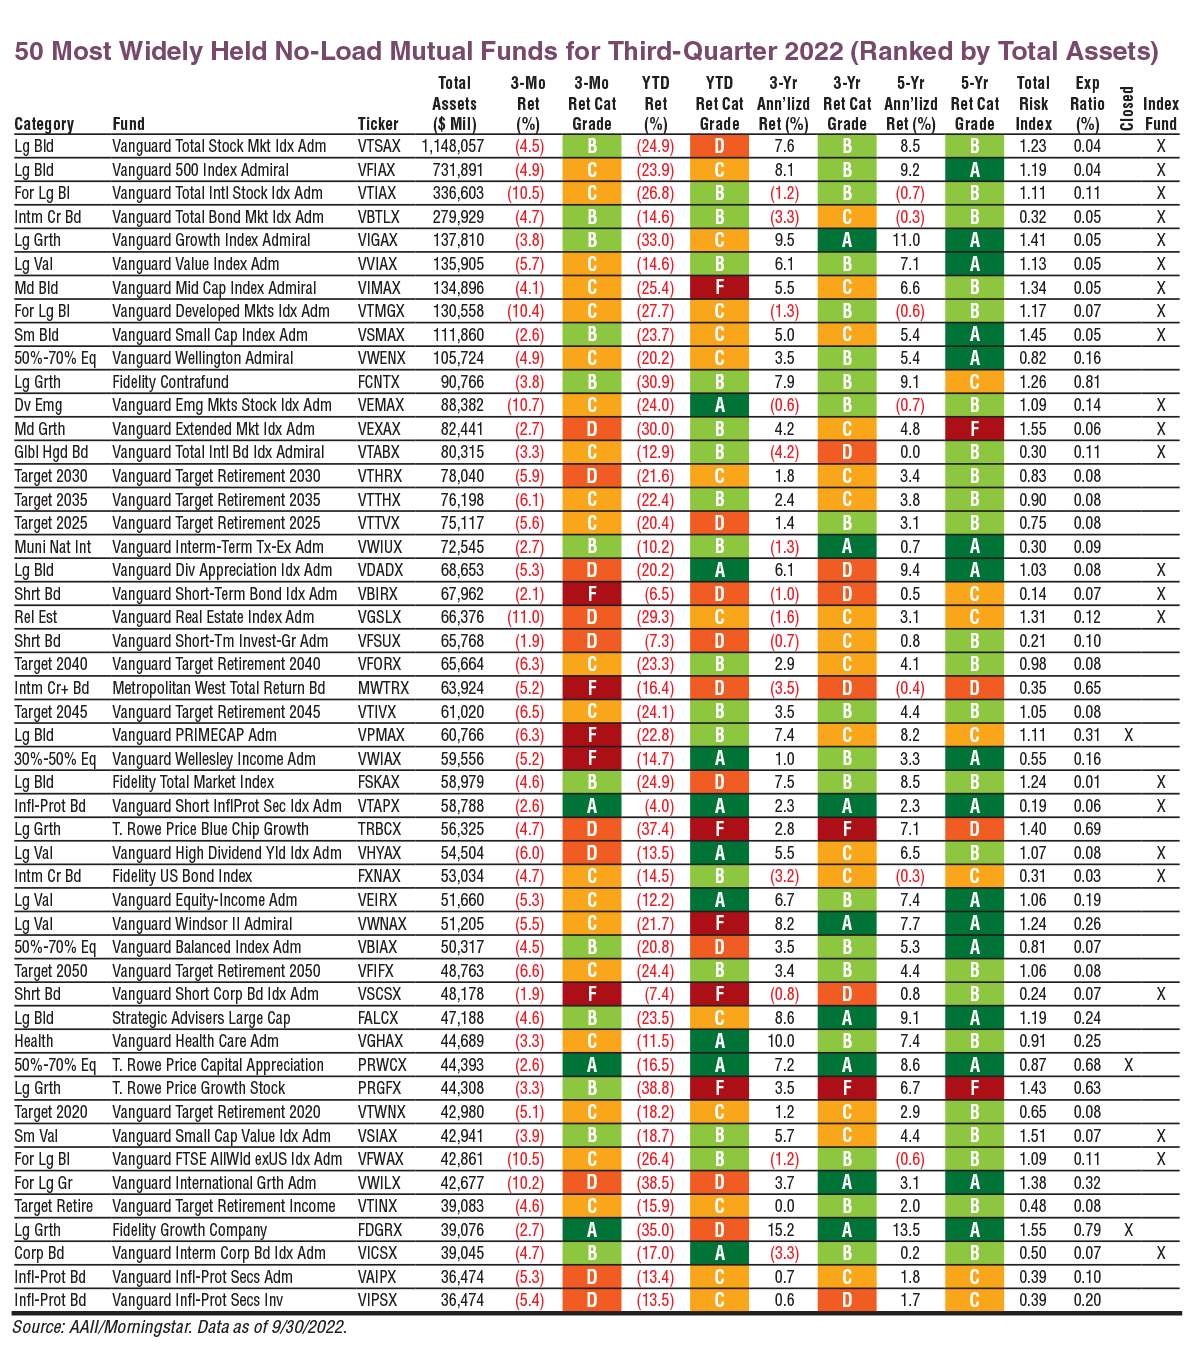
Download the Excel spreadsheet for this table: 50 Most Widely Held No-Load Mutual Funds for Third-Quarter 2022.
Overall, those two funds tell the general story of mutual fund and ETF performance for the third quarter: Almost everything was down, with domestic equity strategies faring better than international equity strategies. The Vanguard Short-Term Treasury fund (VFISX), included in the Asset Allocation Models table on page 25, beat both previously mentioned equity funds with a three-month return of –2.0%.
However, there are upsides to the current market situation once the initial shock of the quarterly numbers passes. Bond yields are at their highest in 10 years, higher interest is being paid on savings and stock valuations are lower. There are opportunities to buy shares of mutual funds and ETFs at lower valuations than were recently available.
Which Mutual Funds and ETFs Are Included?
The top 25 and bottom 25 ETFs and mutual funds shown below represent the best- and worst-performing funds in each respective universe. Mutual funds are required to have at least $5 million of assets under management (AUM), to have a minimum initial purchase amount of no more than $50,000 and to not charge any front- or back-end loads. ETFs are required to have AUM of at least $25 million and an average daily trading volume of at least 5,000 shares. Leveraged funds were excluded. The 50 most widely held mutual funds are the funds most likely owned by AAII members, allowing you to note the performance of funds held by a large number of individual investors.
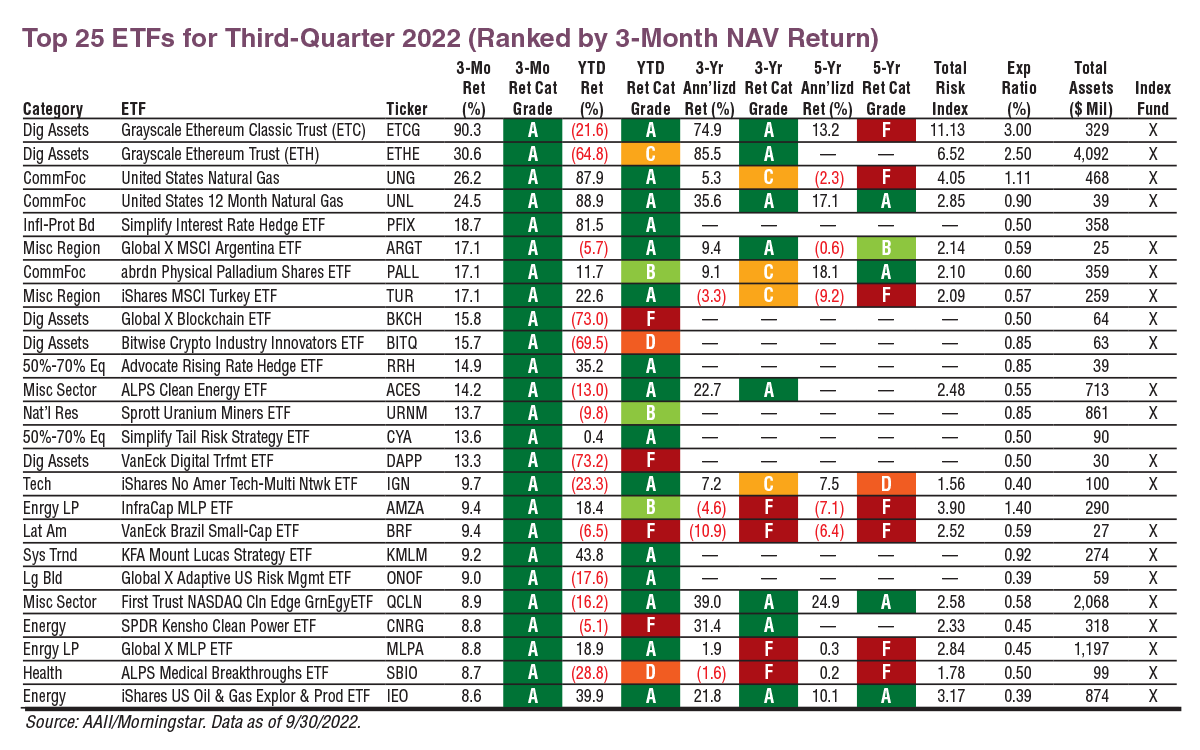
Download the Excel spreadsheet for this table: Top 25 ETFs for Third-Quarter 2022.
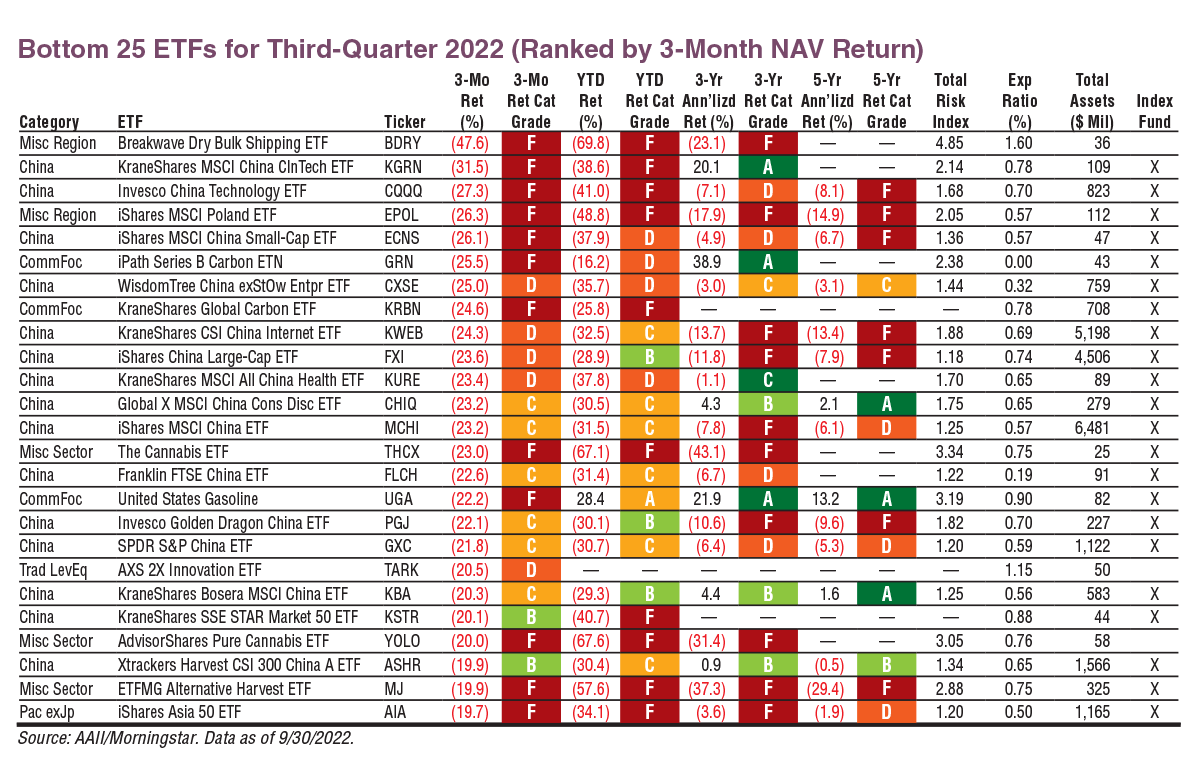
Download the Excel spreadsheet for this table: Bottom 25 ETFs for Third-Quarter 2022.
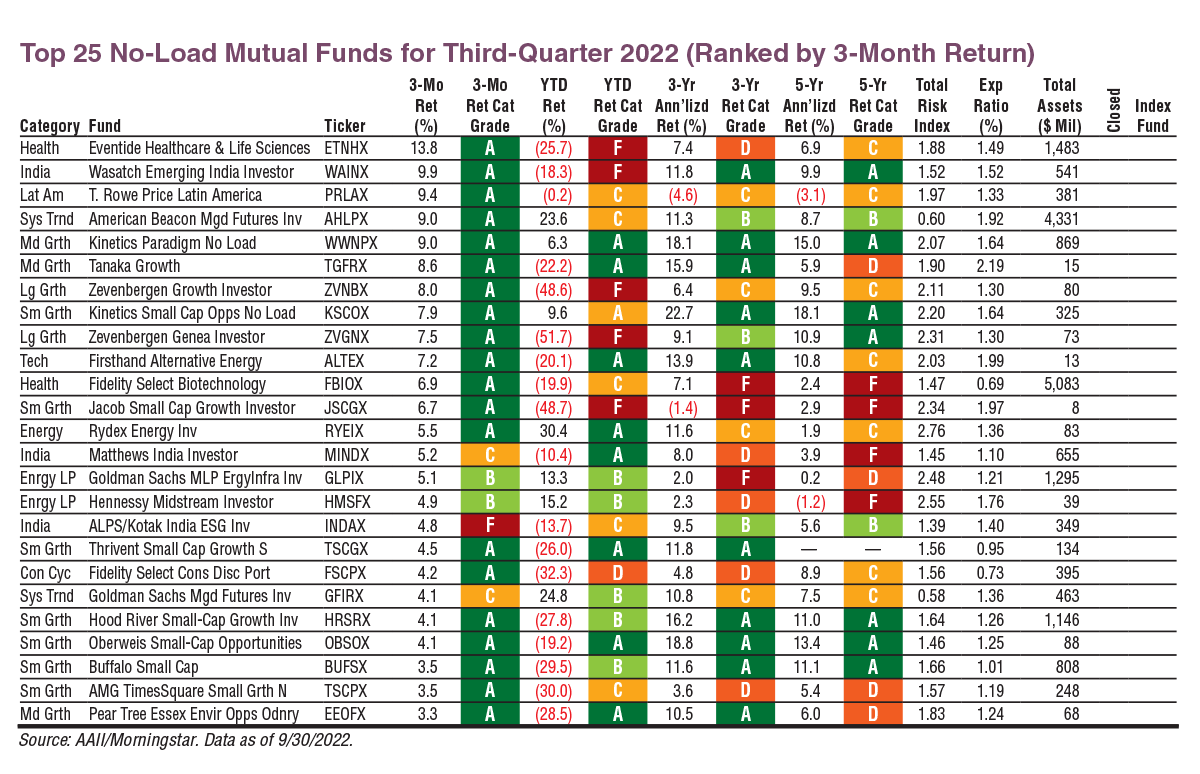
Download the Excel spreadsheet for this table: Top 25 No-Load Mutual Funds for Third-Quarter 2022.
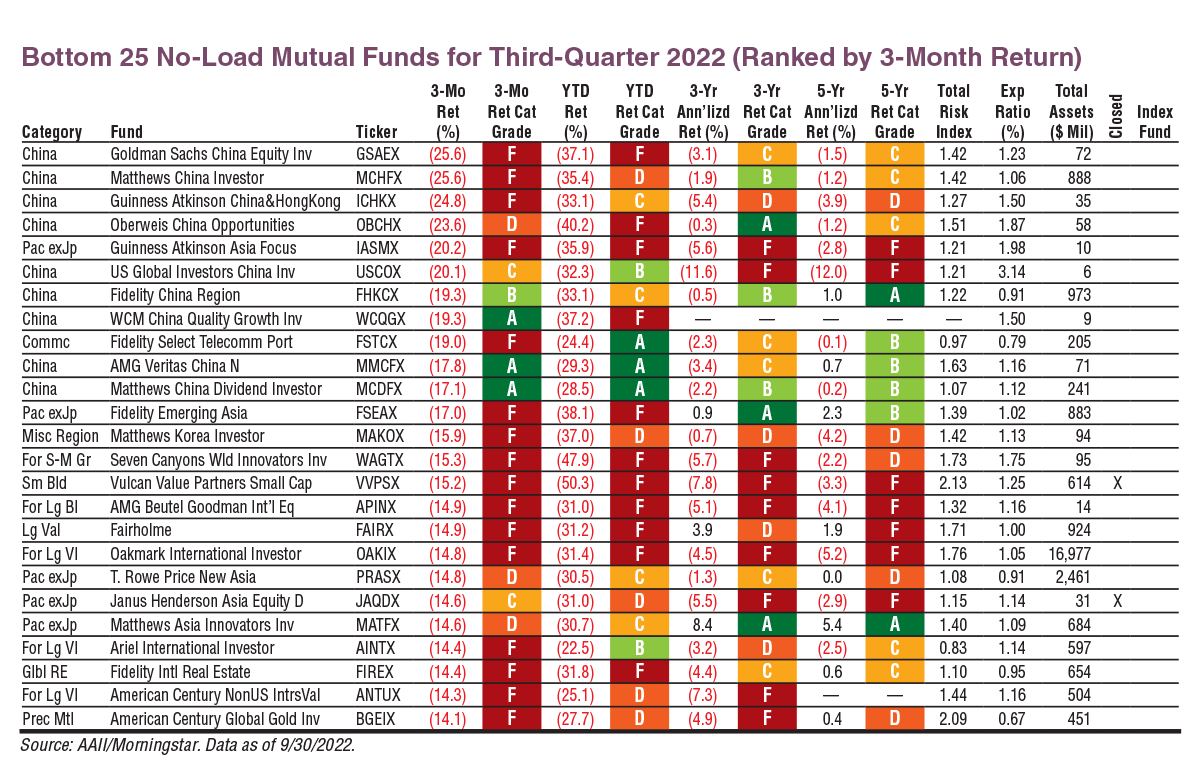
Download the Excel spreadsheet for this table: Bottom 25 No-Load Mutual Funds for Third-Quarter 2022.
The AAII Asset Allocation Models have long served as guidelines that individual investors can use to help construct appropriate portfolios. The models incorporate three key building blocks to a successful allocation strategy: stocks, bonds and cash. [Short-term bonds are listed as a proxy for cash but can easily be substituted with cash equivalents such as money market funds, certificates of deposit (CDs), etc.]
Each model—aggressive, moderate and conservative—applies to investors with different levels of risk tolerance. The performance of the three models is based on hypothetical portfolios comprising mutual funds that represent each asset class. Vanguard index funds are used to limit the impact that decisions by active managers have on returns. These funds were also selected for their very low expense ratios. Vanguard is unique in that many of its ETFs are separate share classes of its mutual funds. This can be seen on the company’s website where the phrase “also available as an ETF” is listed on the pages of the admiral share class versions of the mutual funds.
Along with quarterly returns, the table below shows the year-to-date and annualized three-year and five-year returns with category grades for the funds used to track the models’ returns. We include two additional perspectives for each asset class group. The first is the category average return of similar mutual funds (e.g., the black rows with large-cap blend, mid-cap blend, etc.). The second is the performance of similar Vanguard ETFs.
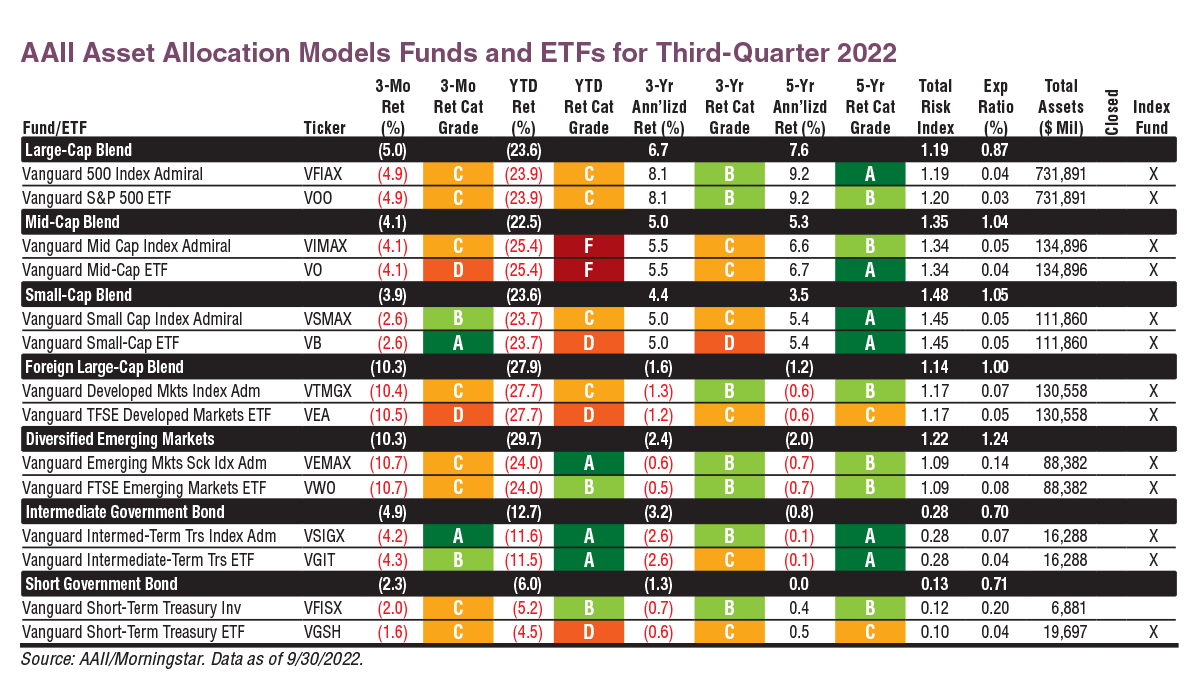
Download the Excel spreadsheet of this table.
Growth Strategies Make a Slight Return to the Top
The third-quarter top-performing mutual funds and ETFs have some divergence in themes. Leading the top mutual funds in representation is the small-cap growth category. Seven funds in this category made the list. The best-performing small-cap growth fund was the Kinetics Small Cap Opportunities No Load fund (KSCOX) with a three-month return of 7.9%.
Kinetics Small Cap Opportunities’ quarterly return far surpasses that of its category average at –1.3% over the same period. Aiding the fund is its portfolio composition, which is overweight in energy (64.4%) and real estate (10.2%) relative to the average for its category at 3.7% and 2.8% of assets, respectively. The fund also has low exposure compared to its category peers in health at 0.0% and technology at 5.7%; the category averages are 22.3% and 23.2%, respectively, based on data from Morningstar.
In light of the fund’s holdings, its outperformance makes sense. Energy represents one of the few sectors with positive returns year to date. The equity energy category is up by 22.4% through the end of September. The technology category is down by 38.4% year to date, representing one of the hardest-hit sectors so far this year. Typically considered to be comparatively less sensitive to economic fluctuations, the health category is also down by 19.3% year to date.
Despite growth-based strategies making up a majority of the top-performing funds for the quarter, value-based strategies are still outperforming them for the year. Growth’s third-quarter rally was a temporary relief that is already fading, based on trends in the Russell indexes, according to Nasdaq. Rounding out this story, one technology fund and two health mutual funds made the list of the top-performing mutual funds for the quarter; three mid-cap growth funds and two large-cap growth funds also made the list.
The categories represented by the top-performing ETFs for the third quarter were wider-ranging than those represented by the top-performing mutual funds. A particular standout is the digital assets category. This is a new category that Morningstar only introduced this past April. Digital asset portfolios invest the majority of their assets into one or more broadly classified areas, including decentralized finance assets, stable coins, currency assets, smart contracts platforms, exchange assets, privacy assets, yield farming and non-fungible tokens (NFTs), among others.
Digital assets are characterized by their momentum and volatility, and most of their risk arises from these factors. Last quarter, digital assets ETFs comprised a prominent chunk of the bottom performers on a quarterly basis. The two top-performing ETFs for the quarter, Grayscale Ethereum Classic Trust (ETCG) up 90.3% and Grayscale Ethereum Trust (ETHE) up 30.6%, are down year to date by 21.6% and 64.8%, respectively. Both ETFs are expensive compared to the average ETF and have higher total risk indexes. Grayscale Ethereum Classic Trust’s expense ratio is 3.00% and its total risk index is 11.13; Grayscale Ethereum Trust’s expense ratio is 2.50% and its total risk index is 6.52. These compare to the total risk index of 1.23 and expense ratio of 0.04% for the Vanguard Total Stock Market fund, the most widely held no-load mutual fund.
Missing among the top ETFs are growth-based strategies, when compared to the top-performing mutual funds. There is one health ETF—ALPS Medical Breakthroughs ETF (SBIO)—and one technology ETF—iShares North American Tech-Multimedia Networking ETF (IGN)—both which generally represent growth sectors. ETFs within the focused commodities category are the second-most-represented category on the list of top ETFs. The United States Natural Gas ETF (UNG) with a three-month return of 26.2% and United States 12 Month Natural Gas (UNL) with a three-month return of 24.5% were the third- and fourth-best performers for the quarter, respectively.
Foreign Investments Take a Hit, Especially China
While there was more divergence between the top-performing mutual funds and ETFs for the third quarter, there is less between the bottom performers. Hard hit were foreign-focused funds, particularly those focused on China. Funds within the China category were the most represented of categories on both lists. Overall, there was a wider variety of categories represented by the bottom-performing mutual funds for the third quarter than those represented by the bottom-performing ETFs.
Outside the U.S., central banks are attempting to keep pace with the Fed’s interest rate increases, as inflation is a global issue. A U.S.-led recession no doubt would have an influence on the developed markets of the world, in addition to the emerging markets. China comprises 31.4% of the MSCI Emerging Markets index and five of the index’s top 10 constituents.
Chinese equity markets tumbled in the third quarter due to lingering issues with the pandemic, a property slump and overall weak global economic indicators. China has maintained a “zero-COVID” strategy, with lockdowns that hamper full return to economic activity in urban areas reporting spikes in the coronavirus. China’s endemic vaccines are less effective than those developed in the U.S. Overall, these are the same issues that put the China category among the bottom performers in the second quarter this year. The Asian Development Bank forecast in September that China’s economic growth would lag that of developing Asia for the first time in more than three decades, according to T. Rowe Price.
The Fidelity China Region fund (FHKCX) is one of the long-term top-performing mutual funds among the bottom performers, with a five-year annualized return of 1.0%. For the third quarter, the fund was down by 19.3%, which is a relatively better performance than its category, with a three-month return category grade of B. As a region-based strategy, the fund doesn’t exclusively invest in China-based companies. Its largest portfolio holding is Taiwan Semiconductor Manufacturing Co. Ltd. ADR (TSM) with a portfolio weight of 17.25%. The fund is competitive with its expense ratio of 0.91%, which earns a category grade of A.
On the ETF side of the bottom performers for the third quarter, a few focused commodities ETFs are present. Specifically, two of these ETFs, iPath Series B Carbon ETN (GRN) with a three-month return of –25.5% and KraneShares Global Carbon ETF (KRBN) with a three-month return of –24.6%, are carbon-focused. This is a relatively new type of strategy that follows the return of futures contracts on carbon emissions credits. These ETFs have only been in existence for three years and two years, respectively.
More Data on AAII.com
Online data on more than 24,000 mutual funds and 3,000 ETFs is updated monthly and available to all AAII members. Visit www.aaii.com/investingideas to access our mutual fund and ETF guides, lists of consistent performers, fund comparison tools and more.
Discussion
FREE REPORT

BARRY J from TX posted over 3 years ago:
Peter N from TN posted over 3 years ago:
You need to log in as a registered AAII user before commenting.
Log InCreate an account