


Wayne Thorp leads a class in AAII's new Essential Investing Video Course. Go to https://www.aaii.com/ves for more information and to subscribe.


Investment analysis falls into two broad categories: fundamental analysis and technical analysis.
Fundamental analysis looks at the underlying financial characteristics of a firm to determine whether or not it is a good investment. It considers the broad macroeconomic conditions that are acting on the company’s business, the competitive landscape in its sector and industry and the individual company’s financials to try to estimate the stock’s fair value.
Technical analysis, on the other hand, is based mainly on the belief that much, if not all, of the fundamental factors are already reflected in the current price of the financial asset. Therefore, all we need to concern ourselves with is the movement of price and volume over time. Based on historical price and volume trends, technical analysis then tries to discern patterns that we can use to try to predict future price activity. The primary tools of technicians are charts and technical indicators, which are mathematical manipulations of past price and volume data.
Charting is an area where computers are invaluable. Instead of plotting price data by hand, you can use a website or software program to type in a ticker and with the click of a button view decades of price data. Depending on your needs, a website may suffice. Our Comparison article in the Q1 2013 issue of Computerized Investing covers the top websites for technical analysis and charting. However, as is typically the case with investment analysis resources, software-based technical analysis programs tend to offer more robust features and functionality and can be geared toward sophisticated technicians. These packages tend to be fee-based, whereas there are many high-quality charting sites online available for free. In addition, there may be an additional fee for data, especially if you wish to perform your analysis on a real-time, intraday basis.
Before you decide on a software-based technical analysis platform, it is a good idea to read through the comparison of web-based services to see if one of them fits your needs. If not, this comparison will help you familiarize yourself with the features and functionality of the top software packages for “mainstream” technical analysis. Our Editor’s Choice picks this year are Investor/RT, MetaStock, ProTA Gold and TC2000.
We focus on programs used by the average technician for charting, technical analysis, and trading system development and testing. For this reason, you will not find “pure” trading platforms intended more for professional traders, or niche products focusing on a single analysis technique.
At a minimum, all of the programs covered here handle stocks, offer charting capabilities and have a library of predefined technical indicators. These programs also will handle end-of-day analysis along with intraday analysis on either a real-time or delayed basis.
The online version of this article includes the comparison grid that examines the key features you should expect to find with any full-featured technical analysis and charting platform. Our discussions in this article are based on the latest, non-beta versions available at the time of this writing (late November 2013). It is always a good idea to verify the features with the software company prior to buying.
What to Consider
Data
Unlike fundamental analysis at the company level, which uses years of financial statement data to determine the financial strength of a company, technical analysis is built upon two primary pieces of data—market price and volume.
There was a time when buying a technical analysis program almost assuredly included purchasing a data feed from a third party. Over the years, many firms have moved the data “in house,” while others still rely on third-party data feeds to power their software. Irrespective of whether the data is from the software company or a third-party vendor, be aware that you will most likely be incurring a recurring cost for data, typically a monthly fee. Therefore, be sure to figure this into your budget, as data costs over time will more than likely eclipse any initial outlay for the technical analysis software.
The following are some of the typical data considerations you may need to make when evaluating a technical analysis and charting program and when seeking out a compatible third-party data vendor (if necessary).
End-of-Day Versus Intraday
Depending on the type of trader you are, you may analyze markets and securities on either an end-of-day (EOD) or intraday basis. End-of-day data summarizes activity during the course of a trading day, with a single day’s trading data typically consisting of the open (first trade) price, the highest and lowest prices of the trading day, the closing price (last trade) and the total trading volume (the number of shares or contracts bought and sold over the course of the trading day). In contrast, intraday data provides periodic updates throughout the trading day on either a real-time or a delayed basis. All else equal, you usually pay a premium for this more timely data.
Ultimately, your investment time horizon will dictate whether you require end-of-day or intraday data. Investors with longer time horizons, or at least those who are typically not making split-second trading decisions through the course of the trading day, will probably be satisfied with an end-of-day or delayed intraday feed. On the other hand, short-term investors and traders will probably want a real-time data feed in order to more closely monitor market movements.
Supported Data Vendors
If the maker of the technical analysis software you choose doesn’t have its own in-house data feed, you will need to select a third-party provider. Among the programs highlighted here, TC2000 and MetaStock use their own data feeds. In the case of TC2000, you get the software and data—on either a delayed or real-time basis—as part of a periodic fee. In the case of MetaStock, you pay an up-front fee for the software and then subscribe to a data feed at an additional cost. Alternatively, you can pay a monthly or annual fee for the software and data feed(s).
Others give users a variety of compatible data vendors from which to choose, allowing you to “shop around” for a data feed and price that suits your investment needs and pocketbook. Investor/RT, for example, currently supports 14 data services. Our fourth top pick, ProTA Gold from BeeSoft, has a fully automated interface for use with Dial/Data but also has a data converter that allows you to import virtually any comma-, tab- or space-delimited data file from a number of web-based data vendors, some of which are free (such as Yahoo! Finance). Investor/RT is the only Editor’s Choice program that allows you to download historical data directly from a free data source (Yahoo! Finance). The comparison grid indicates which data vendors each program supports.
Charting
Chart analysis forms the cornerstone of technical analysis. In fact, many technicians rely solely on what they see on a chart when attempting to predict future price movements.
Chart Types
There are several popular chart types used by technicians, and the programs here differ in the types of charts they offer.
The most common chart types are line and bar charts, and all of the programs in this comparison offer these two chart types. Line charts plot a single price point—usually the closing price—over time. In contrast, bar charts may show up to four data points for a given period—the open, high, low and closing (OHLC) prices for a day, week, month or other period.
Some other common chart types you may run across include candlestick, equivolume, and point & figure. A proper discussion of these charts is beyond the scope of this article. However, you can find articles dealing with charting in the online Computerized Investing archive (www.computerizedinvesting.com).
Chart Templates
A chart template or layout allows you to specify the characteristics of a chart, such as the time period displayed, data periodicity (such as daily, weekly or monthly), chart type and any indicators or drawing tools you wish to be displayed. Programs that allow you to create custom templates generally allow you to save them for future use as well.
Templates are especially useful if you view multiple securities in the same manner. Instead of having to specify the chart characteristics for each security, all you need to do is specify the security and apply the template, and the program creates the desired chart.
Indicators
A technical indicator is the mathematical manipulation of price or volume data, the results of which are then typically displayed on a chart. The number and type of indicators built into a program are important factors to consider when selecting a technical analysis program. However, the raw number of indicators should not be the sole consideration—more is not necessarily better. Instead, the emphasis needs to be on ensuring that the program includes the indicators important to your analysis.
The online comparison grid has links to the websites of the various software companies where you can see a list of the technical indicators each program offers.
Beyond a set of predefined indicators with default values used in calculating them, the ability to modify indicators to fit your particular trading needs and style is a useful feature. Modifications allow you to adjust factors such as the number of time periods used in calculating a given indicator. For example, the most common time periods for a daily moving average are 50 and 200 days, but programs allowing modification of indicators give you the opportunity to adjust the period to one you are more interested in.
Some of the more advanced programs allow you to create custom indicators. While the methodology differs across programs, in general you enter a formula into a spreadsheet-like module or use a “wizard” that walks you through the creation process to build a custom indicator.
Filtering & Alerts
In generic terms, screening is the method of taking a large universe of securities and narrowing it down to a more manageable number with similar characteristics. In the context of technical screening, you are isolating securities that exhibit certain technical properties, such as price or volume behavior, moving average breakouts, or overbought or oversold conditions based on various indicators. Users are typically able to specify both the universe they wish to screen and the criteria they wish to use; the program will then generate a list of securities matching the criteria. All of the Editor’s Choice programs in this comparison allow you to perform some type of screening or scanning based on technical indicators as well as fundamental data.
Another useful feature is the ability to receive alerts when certain “technical events” take place. These events can include meeting a specific value for a technical indicator, generating a buy or sell signal through a technical system, or even violating a trendline. Programs may give you the option of selecting groups of securities to watch—such as those held in a portfolio or a “watchlist” of stocks—and then alert you when any of the prices move by a certain percentage (up or down), or when pre-determined price levels are met. These alerts can take the form of on-screen pop-up windows, email alerts, or messages sent to a cell phone or hand-held device.
Trading Systems
Many traders develop trading systems based on technical indicators that consist of sets of trading rules for when to buy, sell, short or cover, and they use a technical analysis program to indicate automatically when these rules are triggered. The rules underlying a trading system can involve a single indicator or a collection of confirming indicators matched to specific market conditions. On page 16 of this issue, we begin a new series on developing your own technical trading system.
Generally, you tend to find trading systems in the higher-end technical analysis packages. All of our top picks offer system trading; however, TC2000 requires its StockFinder module, and with Investor/RT you must purchase the Trading System Tools add-on for an additional monthly fee. You can modify these systems to match your own trading patterns and the securities you track. Advanced traders may also want to develop their own technical trading systems. Again, our top picks allow you to build systems from scratch, although Investor/RT, MetaStock and ProTA Gold do so in a more straightforward and intuitive manner than TC2000.
When developing a new trading system, it is useful to test it using historical price and volume data to get an idea as to how it may perform going forward. To backtest a system, users specify a time period in the past, and the test provides an indication of how the trading system would have performed over that period.
It is important to implement assumptions that mimic the “real world” as closely as possible when backtesting a trading system. Programs allow users to account for such items as slippage (the amount by which a security’s price may move between the time you place an order and when it is actually filled) and broker commissions. Other items to consider are stop-loss methods, user-defined entry and exit points, and whether you wish to trade on long positions, short positions, or both.
The final element of system backtesting is optimization, where the program identifies the optimal variables that generate the highest gain or smallest loss for a trading system over the test period. However, be aware of the popular saying regarding optimization: You can torture the data until it tells you what you want to hear. Investor/RT and MetaStock offer system optimization, while TC2000 does not.
When analyzing the overall effectiveness of a system, it is useful to have access to system reports that provide such measures as rate of return, performance relative to buy-and-hold, maximum drawdown and the profitability of each individual trade. These reports allow you to see the transactions you would have made if you were following the system and measure the success (profitability) and riskiness of the strategy over the testing period. The ability to rank and compare the performances of trading systems is a valuable tool for finding out how different systems perform in different market conditions.
Program Help & Support
Technical analysis programs tend to be some of the more complicated software packages you will run across in the investment analysis and tracking arena. Therefore, you want to make sure you have the resources to get to know the program.
All of our Editor’s Choice programs offer in-depth user resources to help you get the most out of your investment. Through their respective websites or online help systems, each offers multimedia tutorials or guides that help you navigate through the programs.
Long gone are the days of receiving printed manuals. Now when you run into trouble using a software package, you can usually refer to a help system within the program. If the program’s help system isn’t as useful as you would like it to be, ideally there will be human support available through email or telephone. All of the programs in this comparison offer, at a minimum, free email support.
Some software companies have even built online communities where you can interact with fellow users. At these forums, you can exchange ideas relating to trading and gain insight on how to get the most from your technical analysis package. Users of the four Editor’s Choice programs will find discussion forums that allow you to interact with other users and exchange ideas.
Editor’s Choice Picks
This year we’ve awarded Editor’s Choice status to four technical analysis and charting programs: Investor/RT, MetaStock, ProTA Gold and TC 2000. Long-time subscribers to Computerized Investing are probably familiar with these names, as all of them have been a CI top pick over the last decade. We have added ProTA Gold back into the mix this year, as it offers a more middle-of-the-road option for Mac users compared to Investor/RT, which is available for both Mac and Windows.
Investor/RT
Investor/RT by Linn Software is unique in that it comes in both Mac and Windows versions. Its uniqueness extends beyond that, however, because the Mac version offers the same features and functionality as the Windows version, a rarity among investment analysis software. The program satisfies the needs of active technical traders, especially those running Mac OS. It offers intraday analysis, several different chart types, custom indicator and trading systems creation, system optimization, order placement, and portfolio management functions. The program also supports one of the largest collections of data vendors of any technical analysis package.
There are four main versions of the program—Standard and Professional versions supporting either intraday real-time data (Investor/RT) or end-of-day data (Investor/RT End-of-Day). The Standard edition ($25 a month end-of-day or $45 real-time) offers charting, predefined technical indicators and drawing tools, custom instruments, and news monitoring. The Professional edition ($35 for end-of-day or $70 a month for real-time) offers added functionality through the Investor/RT user language, called Real Time Language (RTL). With RTL, users can perform custom scans, create custom indicators and trade signals, and build advanced indicators. You can also purchase an add-on called Trading System Tools for either the Standard or Professional editions of Investor/RT (for an additional $15 a month for end-of-day or $29 a month for real-time); this allows you to develop, optimize and implement technical trading systems either in real time or on an end-of-day basis.
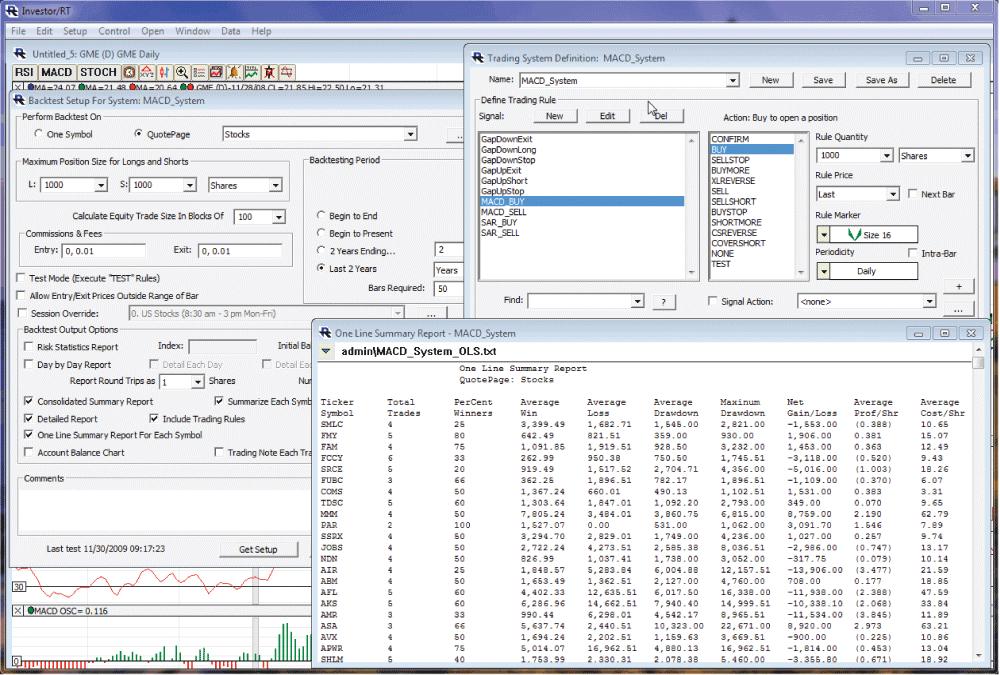
Investor/RT offers several popular chart types—including line, bar, candlestick and point & figure—along with a library of over 150 technical indicators and line studies. In addition, it provides candlestick pattern recognition. Users may select from any of the over 40 predefined patterns, and the program will mark each pattern’s occurrence on the display—even on an intraday basis.
Investor/RT also offers position tracking and portfolio management features not found in many trading platforms. Investor/RT can track long or short positions and gains and losses on stocks, mutual funds, futures and equity/index options. The system also tracks transactions—such as cash, dividends, commissions and interest—in order to calculate the annualized rate of return for each open position.
The version we reviewed—11.2—supports several real-time, delayed and end-of-day data services, depending on the type of trader you are. For futures traders, the software supports many real-time providers, including Infinity Futures, TransAct Futures and Zen-Fire. One nice feature is Investor/RT’s support of free historical quotes and fundamental data from Yahoo! Finance. However, its usefulness is limited by the fact that you are only able to download about three years of daily data per stock, definitely not enough for backtesting of a trading system, let alone analyzing long-term trends.
With Investor/RT Professional, users can create custom indicators, trading systems (using the Trading System Tools add-on) and scans with RTL. The scan function allows users to identify trading signals being generated. Scans can be based on technical indicators, fundamental data, and current or historical prices and can be run using tick (smallest up or down movement in price) or minute data as well as daily, weekly and monthly data. Once a scan is completed, the results are presented in a quote page that can be sorted on a number of data elements.
The Trading System Tools add-on provides trading system development, testing and optimization to Investor/RT. Users can organize trading signals into a set of trading rules and then backtest these rules over any desired time period. To analyze the results of backtesting, this module also offers detailed reports. The trading system optimization feature allows users to backtest ranges of values for the variables used in the trading system to find the optimal values and periodicity. Once a trading system has been developed, backtested and optimized, trading system deployment allows for the plotting of trading systems on a chart on a real-time or end-of-day basis. You can deploy individual trading rules as indicators on a chart or the trading system as a whole. The program’s Realization feature allows you to backtest and optimize a system over a given period and then test the system over a subsequent period immediately following the backtesting/optimization period. Using historical data, you are able to see how the system would have performed in reality and get an idea of how well the system will perform going forward (although past performance is not a guarantee of future performance). Overall, Investor/RT has features and functionality that rival any high-end technical analysis package. Mac users will also appreciate having such a robust system at their disposal. A wide variety of both end-of-day and real-time data sources is an attractive feature for those wishing to “shop around” for a data provider. The ability to download free historical data from Yahoo! Finance is another welcome (and money-saving) feature. Furthermore, Linn Software has done an excellent job of producing online tools, including an array of video tutorials, to educate their users on how to get the most from the software.
MetaStock
Since its beginning in 1985 as a DOS-based program, MetaStock has blossomed into one of the most robust technical trading tools on the market for individual investors and professional traders. As of 1996, MetaStock’s parent company Equis International has come under the Reuters, then Thomson Reuters, umbrella. Earlier this year, however, MetaStock was acquired by Innovative Market Analysis, which was created by MetaStock president Scott Brown. Offering a comprehensive collection of technical indicators, charting capabilities, and system development and optimization tools, coupled with unrivaled ease of use, MetaStock has established itself as one of the most complete end-of-day programs of its kind. There is also a real-time version of the program—MetaStock Pro—but its price and functionality make it more appropriate for extremely active traders. MetaStock recently rolled out its latest version, XIII, adding to its already impressive array of features.
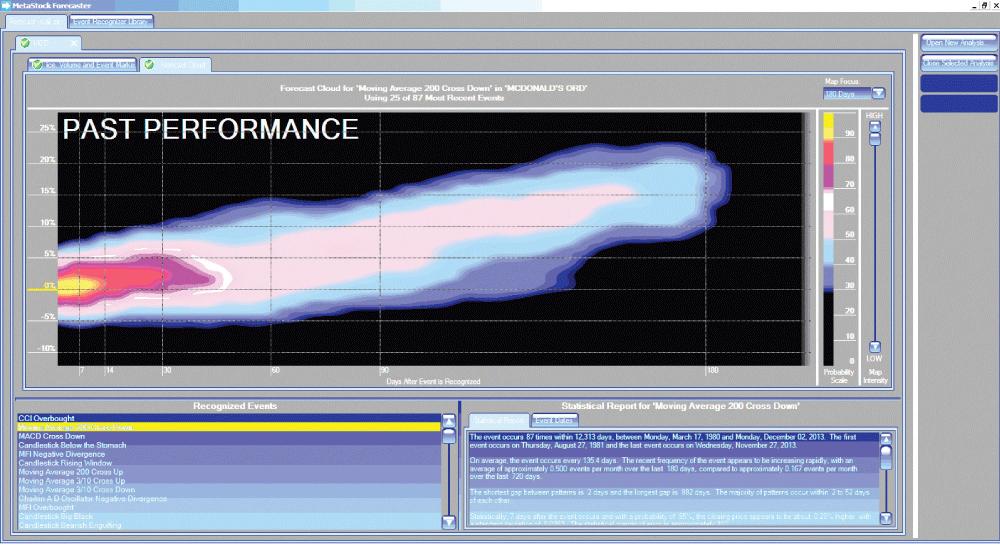
New with MetaStock XIII is the Forecaster, a statistical analysis tool that visually displays how prices may respond after a specific event, such as a traditional technical signal, as well as calendar-based, seasonal or fundamental events. Currently the program tracks more than 60 event recognizers and analyzes the price reaction to these events and then determines the probable performance following future events. Based on this analysis, the Forecaster then plots a probability cloud that indicates the possible future price movement over the next 30, 90 and 180 days.
For those looking for more exotic charting features, MetaStock goes beyond the standard offerings of most charting platforms with nine different charting styles—line, bar, candlestick, equivolume, point & figure, Kagi, Renko, three-line break and candlevolume. The program’s SmartCharts feature automatically saves your charts, along with the underlying specifications, so you can save time by not having to recreate a chart the next time you open it. You can also create chart templates that allow you to apply the same set of indicators and studies to different securities. You can even create a custom default template that is always used when you open a new chart.
MetaStock has the most extensive technical indicator and line study library by far of the programs featured here, with more than 400 to choose from. This includes more than 90 broad market indicators—monetary indicators as well as momentum indicators for both the NYSE and Nasdaq, and more than 40 adaptive indicators with dynamic look-back functionality based on volatility, cycle, or a combination of both. This is in contrast to standard indicators, which use a fixed look-back period, such as a 50-day moving average. In addition, you can create your own indicators using the program’s indicator builder.
The Explorer function in MetaStock allows you to find, compare, filter, rank, search and list multiple indicator values for multiple securities, including stocks, currencies, options and futures. Users can view a list of securities that are generating buy or sell signals or that have broken through some predefined barrier dealing with price or an indicator. MetaStock also ships with a set of predefined scans, and you can create and save custom scans with the same programming language used to create custom indicators.
One useful educational tool for novices and experts alike is Meta-Stock’s Expert Advisors. These advisers—currently more than 70 are included with the software—help you interpret technical analysis signals. Expert alerts provide indications of when current market conditions meet your criteria. There are also Expert highlights that color-code individual prices or significant chart patterns. You can use these Expert systems to receive text, audio or video alerts when certain conditions are met. Using the indicator builder, you can also create your own market advisers.
MetaStock ships with 50 trading systems and allows you to create your own, all of which can be backtested and optimized with the enhanced system tester. You can run one system on a single security, many systems on a single security, one system on many securities or multiple systems on multiple securities. The program also offers features such as the ability to change and edit variables in testing—entry and exit points, commissions and slippage—to help create a more realistic picture of the trading scenario’s results.
Although MetaStock is an extremely robust analysis tool, its developers have also taken great pains to make it very user-friendly. The program offers a comprehensive on-board help system. In addition, the MetaStock and Equis websites offer user forums, free webinars (online seminars) and video tutorials, and real-time online support chat.
The price for MetaStock End-of-Day with a subscription to the Reuters DataLink data service begins at $59 a month ($565 per year) and goes as high as $569 a month ($4,505 a year). Alternatively, you can purchase the MetaStock software on a stand-alone basis for $499.
MetaStock offers everything a seasoned trader needs—custom indicators, trading system development, backtesting, optimization and scanning capabilities. Despite its potentially intimidating lineup of features, MetaStock is also one of the most user-friendly programs we have ever run across. Furthermore, the extensive educational resources available within the program and at the MetaStock/Equis website allow neophytes to grow into the program. When combined with Equis’ highly rated, and free, technical support, you have one of the top products for technical analysis.
ProTA & ProTA Gold
ProTA and ProTA Gold from BeeSoft are making a return appearance as an Editor’s Choice, as they are two of the more complete technical analysis programs designed exclusively for the Mac. They can handle a wide variety of assets and markets—equities, mutual funds, indexes, futures, options, bonds, and commodities—on an end-of-day basis.
ProTA offers an array of charts to satisfy the needs of most technicians: line, bar, point & figure and candlestick. In addition, it offers over 40 fully customizable technical indicators and line studies.

The program’s portfolio tracking module allows users to enter buy and sell trades and it will display, analyze and rank trades in a number of ways. It also generates statistics such as cost basis, return on investment, profit/loss and more. Users can track technical information such as moving average values and volume activity, as well as post trade entry and exit points and track overall performance.
ProTA Gold has all of the same features as ProTA, as well as advanced features found in high-end technical analysis packages with much higher prices. If you are not satisfied with the existing library of technical indicators, ProTA Gold gives you the added flexibility of creating an unlimited number of custom indicators. Custom indicators may then be plotted on charts, ranked in a portfolio sheet, used as scan criteria in the database scanner and used to generate buy/sell signals in custom trading models. The BeeSoft website also has a library of user-created indicators that can be downloaded and installed.
For those interested in creating trading systems, ProTA Gold offers that functionality as well. You can specify trading rules for entering and exiting both long and short trades. To simulate real-world accounting, ProTA Gold allows you to specify commissions, slippage and idle fund interest rate. The program will then plot buy and sell points on the chart of the security being analyzed, generate trade lists and summary statistics, and optimize the system.
ProTA Gold will also scan for securities that meet user-defined technical criteria. You can specify one or several technical or performance-based values and the program scans the entire database or a portfolio of securities for those that fit the parameters. Securities that pass the screen are then placed in a portfolio sheet where you can view or rank the results.
Both programs allow for direct data downloading from Dial/Data. In addition, with the Universal Text Importer that is included with both packages, users can import data in a number of formats, including Meta-
Stock, Excel, and ASCII. Probably the only real shortcoming of the software is that it doesn’t support real-time data, a serious issue for active traders. However, if you are a Mac user who is satisfied with end-of-day analysis, ProTA and ProTA Gold are well worth your consideration.
TC2000
TC2000 from Worden Brothers is our final top pick among technical analysis and charting software. The program offers a combination of solid charting and technical analysis capabilities, ease of use, and unique features, making it one of the most popular analysis tools on the market today. Add Worden’s award-winning data feed, and you have a program that suits the needs of most beginner and intermediate technicians.
TC2000 version 12 is the only offering here that operates in the cloud; all you need is a Web browser to run the program, irrespective of your operating system. This means Mac users can run TC2000 on Mac OS X.
TC2000 comes in end-of-day (Gold) and streaming real-time (Platinum) versions. However, the Gold version does offer certain “real-time” quotes, provided by the BATS exchange. Similar to MetaStock, TC2000 only supports a proprietary data feed for direct data updating. The Gold software and data package costs $30 per month, and Platinum costs $90 a month. The database itself is especially broad, containing over 5,900 U.S. common stocks, nearly 3,800 Canadian common stocks, more than 16,000 mutual funds and nearly 1,300 U.S. exchange-traded funds (ETFs). The program comes with dozens of predefined watchlists, which allow you to view a group of stocks such as the NASDAQ-100 index component stocks or the stocks currently held in the iShares U.S. Aerospace & Defense ETF (ITA). There are also watchlists for Morningstar industry groups and subgroups. Once you have selected a watchlist, you can run a slideshow of the charts for the symbols in the watchlist. You can also create and save custom watchlists.
TC2000 offers the basic chart types—bar, candlestick and line—along with a library of more than 100 technical indicators, including some proprietary indicators that are exclusive to the program. One unique feature is that when you click and drag the cursor between two points on a chart, the program will calculate the total and annualized return for the period selected. If you wish to go beyond the provided indicators, you can program your own. Compared to programs like MetaStock, creating custom indicators in TC2000 is relatively clunky.
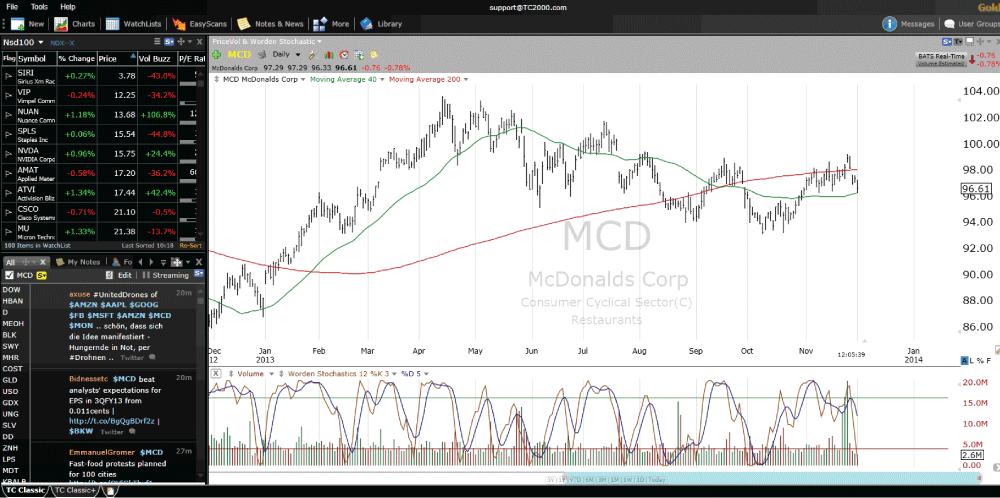
With TC2000’s scanning functionality, you can locate symbols meeting custom search criteria. You can run scans against the entire Worden universe or against subsets, such as industries or personal watchlists. Simultaneously, you can scan for long-term technical and fundamental conditions, as well as intraday conditions. The software comes with a dozen predefined scans, and users can save custom scans. Users will find predefined lists of index and industry components.
The level of customization TC2000 offers makes it extremely appealing. Users can design workspaces to suit their needs, with watchlists, charts, alerts, scans and more. You can link watchlists and charts so that you only need to select a symbol from the watchlist, and the respective charts in your workspace will reflect that symbol. Your options are almost limitless.
| Criteria are rated on a scale of one to five, with five denoting the best score. Charting ratings are based on the number of chart types each program offers and the ability to create custom chart layouts or templates. Indicators ratings are based on the number of indicators provided, and the ability to edit or create new indicators. Trading Systems ratings reflect the ability to apply indicators to a security to generate buy/sell signals, the number of systems the program or service provides, the ability to edit existing systems or create new systems, and the ability to backtest and optimize a system. Screening/Sorting rates the ability to scan a universe of securities for those that match specified criteria, edit existing screens or create new screens, sort portfolios and screening results, and receive alerts based on various criteria. Documentation rates the quality of printed materials, online help and manufacturer support. Ease of Use rates how simple the program is to install, learn and operate. |
|
Indicators/ Drawing Tools |
Trading Systems |
Screening/ Sorting |
Docum-entation/ Tutorials |
Ease of Use |
Software Cost/ (AAII Discount) |
||||
| Charting | Pros | Cons | |||||||
|
Investor/ RT 11.2 End of Day Std |
5
|
4
|
4*
|
3
|
4
|
3
|
$25/mo.
|
+Extensive portfolio mgmt capabilities
+Win & Mac same features
+Direct downloa-ding from free histor-ical data
provider |
–Trading Tools
add-on only has sample trade systems
–Can
create indicators only in Pro |
|
Investor/ RT 11.2 End of Day Pro |
5
|
5
|
4*
|
5
|
4
|
3
|
$35/mo.
|
||
|
Investor/ RT 11.2 Std |
5
|
4
|
4*
|
3
|
4
|
3
|
$45/mo.
|
||
|
Investor/ RT 11.2 Pro |
5
|
5
|
4*
|
5
|
4
|
3
|
$70/mo.
|
||
|
www.linnsoft.com
|
Trading
Tools add’l $15/mo. or $29/mo. |
|
|
||||||
|
*with Trading System Tools.
|
|
|
|||||||
|
MetaStock XIII End of Day |
5
|
5
|
5
|
3
|
5
|
5
|
software, $499; software & EOD data, $59/mo. or $565/yr.
& up |
+Free
online classes & groups
+Expert Advisors
+Nine chart types
+New Forecaster predicts future price action for events
|
–Complex program
for casual users
–Premium add-ons
can greatly increase overall cost |
|
www.metastock.com
|
|||||||||
|
|
|||||||||
|
|
|||||||||
|
|
|||||||||
| ProTA 3.25 & |
3
|
3
|
3.5*
|
3.5*
|
3
|
4
|
$129; Gold, $299
|
+Solid capabilities
at a reason-able price
+Universal Text Importer handles
many data formats |
–No
support for real-time data |
|
ProTA Gold 3.25 |
|
|
|||||||
|
www.beesoft.net
|
|
||||||||
|
*with ProTA Gold.
|
|
||||||||
|
TC2000 Version 12.4 |
4
|
4
|
3*
|
4
|
5
|
4
|
Gold, $29.99/mo.
or $299/yr.; Platinum, $89.99/mo. or $899.90/yr. |
+Cloud version
Win & Mac compatible
+Extensive training resources
+Highly customi-zable work
spaces |
–StockFinder module
Win only
–Custom indicator creation not intuitive
|
|
www.worden.com
|
|||||||||
|
|
|||||||||
| *with StockFinder BackScanner w/Platinum subscription. | |||||||||
For advanced stock screening and charting, you can upgrade your Gold subscription to Platinum ($90 a month) to access StockFinder. However, it is a Windows-only program and not available in the cloud. StockFinder offers a broader library of more than 130 technical indicators along with company fundamental data, earnings estimates and analyst ratings. You can create your own indicators and backtest any indicator-based trading rule, but optimizing capabilities are not offered. Lastly, Platinum subscribers can connect to their TD Ameritrade, options-
Xpress or Interactive Brokers account. I didn’t find StockFinder to be as intuitive as TC2000, but a collection of free webinars and other resources can help you better understand the functionality offered.
One of the more interesting Platinum features is that the software allows users to interact with each other. Platinum subscribers can join more than 100 public and private chat rooms or create their own. Platinum subscribers can also upload files to the Platinum community as well as download files from other Platinum users.
Users will appreciate the collection of resources available to them in order to learn about the program. There are hours of webinars and video tutorials available online, with new events being offered all the time. There are also a variety of discussion forums where you can post questions regarding the program.
Discussion
FREE REPORT

Vincent Lue from CA posted over 12 years ago:
abas rezvani from nj posted over 12 years ago:
William Haun from CO posted over 12 years ago:
Sunil Bhole from GA posted over 12 years ago:
Vernon Roberts from FL posted over 12 years ago:
You need to log in as a registered AAII user before commenting.
Log InCreate an account