

Related

AAII Community
When used properly, conviction can assist in evaluating a price move’s relevancy, trend strength and probable direction.

Raymond Rondeau leads a class in AAII's new Essential Investing Video Course. Go to https://www.aaii.com/ves for more information and to subscribe.
Liquidity, which includes volume and bid-ask spreads, is a key part of analyzing a stock. Investors following a strictly fundamental approach will typically check how actively traded a smaller or less well-known stock is to ensure they can buy and sell shares with ease. Investors who use technical analysis either as their primary or secondary approach will often compare relative volume levels and changes in those levels to established price trends on their charts.
In this article, I cover the conventional elements, theory and basic approaches associated with classic volume analysis. Then, I expand this study to the concept of “conviction” and some new tools related to this approach. Even if you don’t typically look at charts, these concepts will help you better understand the dynamics of price movements and they may even assist you with when and where to place a buy or sell order.
Conviction: A general term that looks to represent a more accurate measurement of the investment activity over a given time period than volume alone. In its most basic form this would be dollar volume.
Chaikin’s Accumulation/Distribution Oscillator: A volume-based technical indicator developed by Mark Chaiken. It measures and displays a cumulative total of up and down volume based on a multiple of where the investment closed in relation to the day’s range.
Dollar Volume: Closing price of a security multiplied by the number of shares traded.
Liquidity: The ability to quickly buy and sell securities without significantly affecting their market prices. Liquidity declines when it is harder to make a trade due to an imbalance in the number of buyers and sellers, or because of price volatility.
On Balance Volume (OBV): A volume based technical indicator developed in 1963 by Joseph Granville. OBV measures and displays a cumulative total of up and down volume based solely on if the investment finished higher or lower for the day.
Technical Analysis: A type of stock analysis using market price data and volume data, typically displayed graphically in charts. The charts are analyzed using technical indicators. Basic concepts are applied to charts, including relative strength analysis, trend, consolidation and support and resistance. Identifying the trend is a large part of technical analysis, as is identifying chart patterns.
Volume: The number of units (shares or contracts) of a security transacted in a given time period. Daily volume and volume relative to the average are tracked on a technical chart to help determine the significance of price moves.
Volume is simply the number of units (shares or contracts) transacted in a given time period. For this article, the time period will always be one day.
A common way to describe volume is to say stock ABC closed at $100 on 10 million shares. For those newer to investing or technical analysis, this means that 10 million shares of ABC exchanged hands throughout the trading day.
We then take this volume amount (10 million shares) and plot it on a single bar on the bottom of a price chart. The height of the volume bar represents the amount of volume during that day with taller bars representing more (greater) volume.
Additional information is also usually included in each bar. The bar is green if a security’s price finished up (up volume) from the open. The bar is red if the security’s price closed down (down volume) from the open.
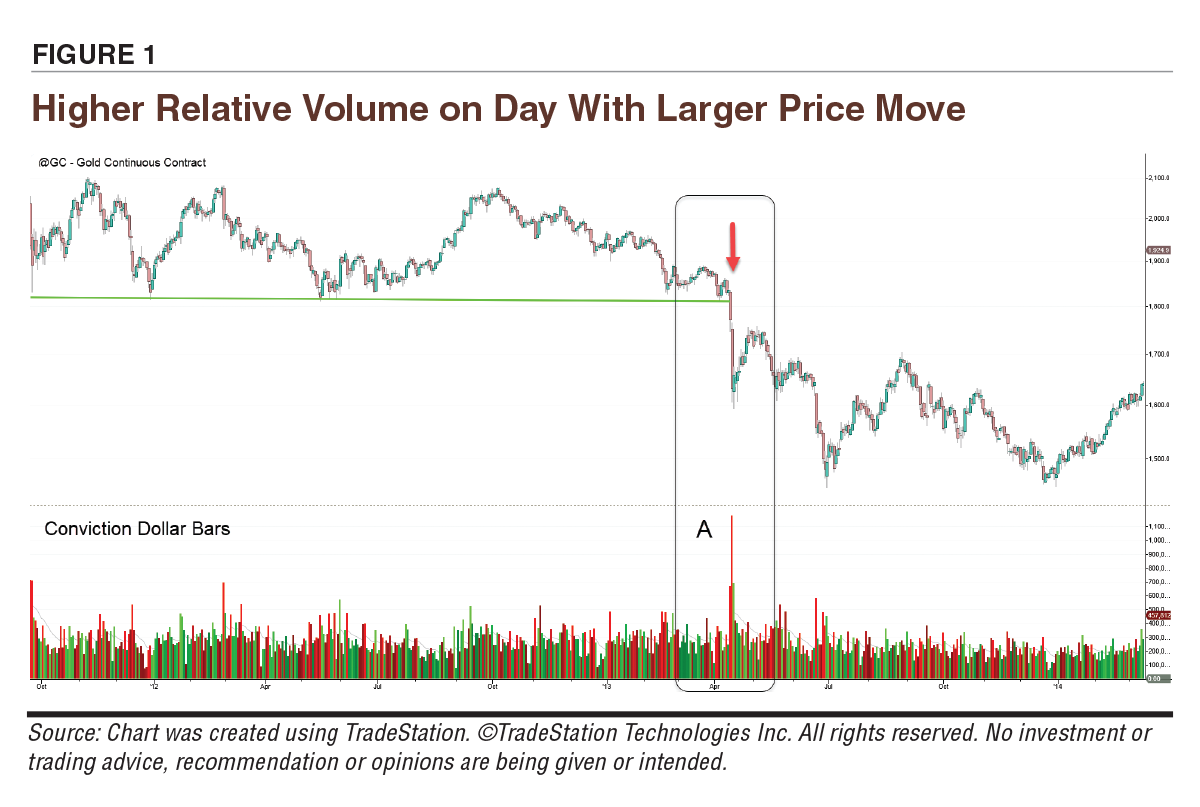
It is believed (and logical) that price movements on days with relative heavy volume are more important and supportive than price moves on days with lower relative volume. An understanding of relative volume is important because a high or a low volume level is only relative to each security. By comparing a day’s volume to a security’s average volume on a chart, an investor can easily determine if the day’s volume was relatively high or low and if the corresponding price move was of increased or limited significance.
This is based on the belief that we should not only give more importance (relevance) to days with larger price changes, but that we should also give more weight or importance to those days with higher volume—as you can see in Figure 1 at point A.
The reasoning behind this theory is that the relatively heavy participation (volume) is likely due to a new and unanticipated revelation about the security, a significant technical event or a large institution being highly active in the security. All are considered to be important factors that can impact future price direction. That is why they are closely watched by investors who make use of technical analysis. The relationship is similar to a negative earnings surprise, or an unexpected dividend cut, which often leads to extremely high relative volume and then a tendency for continued price declines. Of course, these relationships also apply to individual days when there is relatively high volume on a strong upward price move, which signals a likely continuation of higher prices.
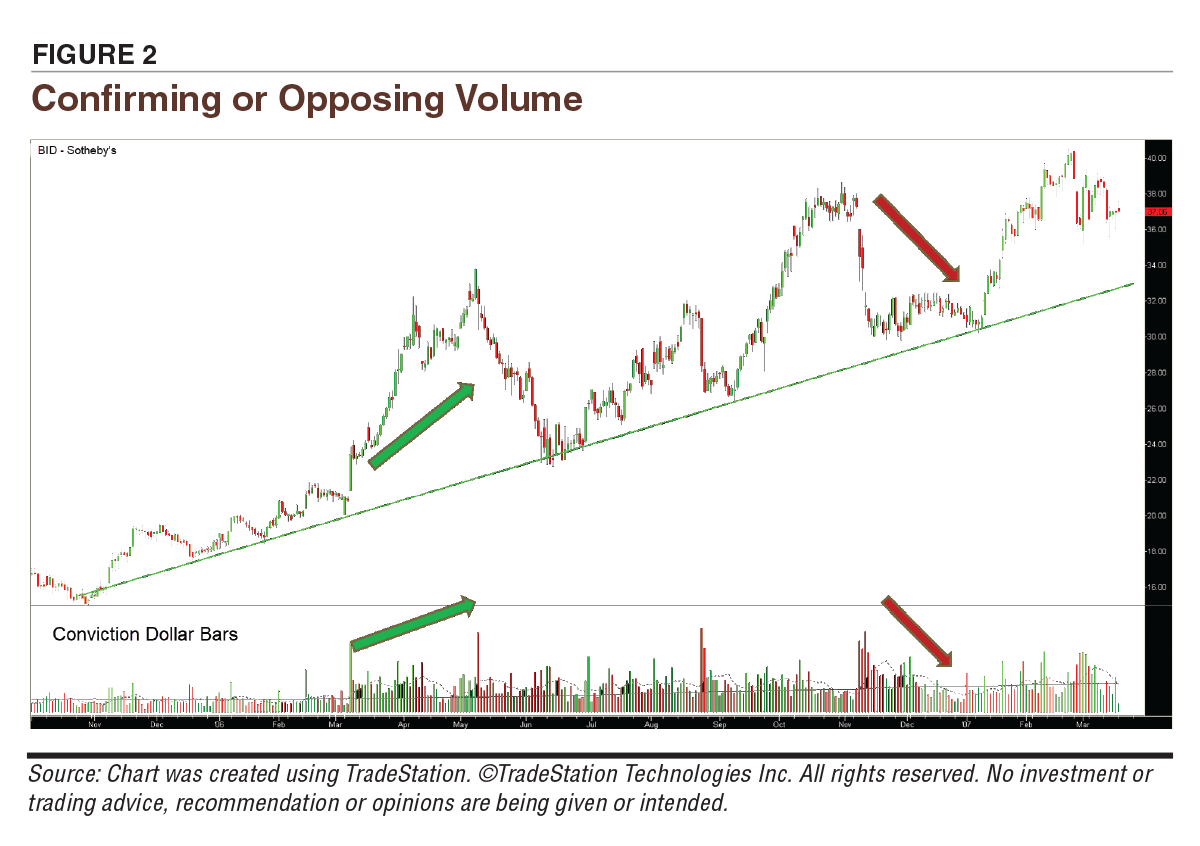
While an individual high-volume move can be important, the most popular use is to compare volume trends to price trends over time to evaluate the probable sustainability of the current price trend’s direction.
Higher relative volume levels expanding with price moves in the same direction of the trend are interpreted as being supportive of the continuation of that current trend. Note the green arrows in Figure 2.
Similarly, lower relative volume levels on diminishing normal natural price retracements back toward the trend are also considered to be supportive of the current trend. Note the red arrows in Figure 2.
If we see the opposite, meaning large increasing volume moves on the down days or downward moves and smaller decreasing volume moves on the up days or upward moves, it would be interpreted as a sign that the current uptrend may be less likely to continue and possibly reverse.
The bottom line is that both volume levels and trends in volume are important measurements when evaluating a security’s price action.
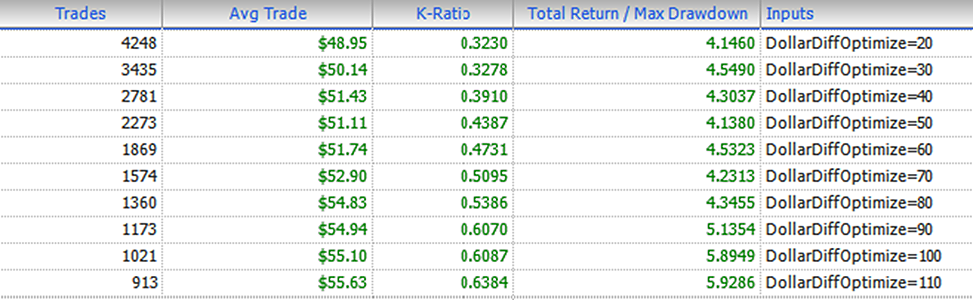
To test the theory that conviction is a relevant factor when evaluating price action, backtesting was performed on every stock in the S&P 500 over a 10-year period. Each row in the table represents the exact same strategy test but with a stricter criterion requiring a higher level of volume (conviction) for the investment to be placed. These levels can be seen in the far-right column where the volume/conviction levels are being increased from top to bottom.
As expected, the tighter the restriction (higher volume/conviction), the lower the number of investments that were executed (first column). When you look at the average trade return, K-ratio and the total return/max drawdown columns, you can see that the results improved in all three categories (higher is better) almost universally every time more conviction was required. The K-ratio measures the consistency of the growth of return.
These linear results fortify the belief that the use of volume/conviction is a viable measurement.
On first inspection, it’s hard to argue the reasoning for the applications and the usage of classic volume-based tools. Unfortunately, the reality is that the markets have changed quite dramatically since these tools were first developed decades ago.
Markets are more volatile; they are globally reliant, causing frequent price gaps; they are more correlated, which causes volume surges in multiple asset classes; and there are increased opportunities for margin, leverage and derivatives. In addition, there are dark pools and high-frequency trading (HFT) can skew volume readings completely by itself, with reports of 50% or more of all volume on an exchange now being due to high-frequency trading.
These factors have clearly changed the numbers, reporting and calculations associated with volume over the years, but surprisingly few have looked for adaptations.
The good news is that the theory and reasoning of basic volume analysis as previously outlined is generally sound. There is no need for a paradigm analysis shift. Rather, I would propose that a few simple calculation adjustments and a change in the way that this information is displayed is likely all that is needed to improve results.
First, the wording or term “conviction” that we are using is meant to be descriptive—and to be clear, this concept has been around for as long as volume has. In fact, in its most basic form, conviction is almost identical to dollar volume. Both values represent the approximate total dollars exchanged over a given time period.
The box on page 18 shows a simple example of a dollar volume calculation. Multiplying the closing price of the day, say $10, by the number of shares traded, say one million, leaves us with a dollar volume of $10 million.
How does this conviction differ from dollar volume? Conviction uses the average of each bar’s high, low, close and open prices as opposed to the closing price. Because closing prices tend to gravitate to the high and low bar extremes (fear and greed), average price likely gives us a more accurate estimation of the total dollars exchanged.
Why not use volume-weighted average price (VWAP) to calculate the “exact” number of dollars? Because many charting platforms don’t offer historical VWAP on daily bars to perform the calculations.
In truth, the differences in the calculation between dollar volume and conviction for this article are irrelevant, but the benefits of using conviction over volume are not.
Consider how we think about investing. We think in dollars, not in the number of shares. We balance our portfolios that way. We assign a certain percentage of our portfolio dollars to certain asset classes. We don’t purchase equal amounts of shares in different mutual funds, exchange-traded funds (ETFs) or stocks—we use dollar amounts.
Conviction allows better relative liquidity comparisons between securities. For example, let’s say a security is trading at 10 million shares per day. At first glance, this would seem to offer an investor greater liquidity than a security trading only 10,000 shares per day. But what if the 10 million share issue is a penny stock trading at $0.10 per share for a total of $1 million per day? That dollar amount would tell us a very different story than the stock trading only 100,000 shares at a price of $100 for a total of $10 million. Volume amounts are obviously misleading for different securities, but they can also be misleading for the same security, and this is where things get interesting.
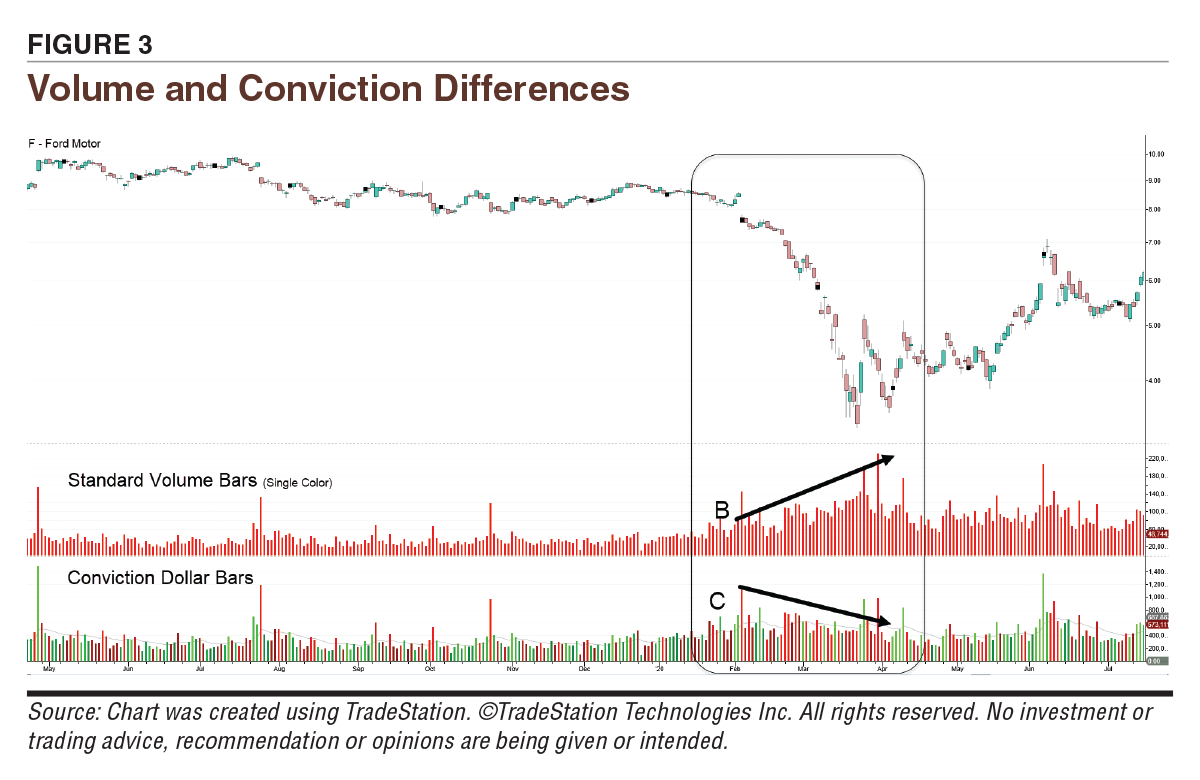
In Figure 3, single-colored volume bars are plotted in the middle pane and conviction dollars are plotted in the lower pane. At point B, because the amount of selling pressure seems to be increasing with the volume bars, we would conclude that the downtrend intensity is increasing and likely to continue. Looking at the actual dollar value (conviction) at point C, we can see that it is actually decreasing from a total of around $100 million per day to $80 million per day from the start of the downtrend. Yes, the volume may be increasing, but that is because the stock’s prices during this period are less than half of what they were when the downward trend started.
Unfortunately, this phenomenon has hurt many investors who have attempted to use volume analysis in this manner. It is not because they did not know the rules, but it is due to the visual volume skew that occurs on large price moves. When prices drop dramatically, it looks like selling pressure is increasing when in fact it is only the share amount that is increasing since the prices are now lower. And this works both ways when prices rise dramatically, it looks like the buying pressure is decreasing when in fact only the share amounts are decreasing because the prices are now higher.
This results in the exact opposite conclusion of what an investor would want. For example, let’s say that the conviction, or the dollar volume, remains the same throughout a trend with no true change in participation intensity. Volume would then appear to be increasing and guide us to sell low on a downtrend. It would also then appear to be decreasing on an uptrend and guide us to sell prematurely. Unfortunately, this volume price–related skew has led many investors to the wrong side of the decision-making process.
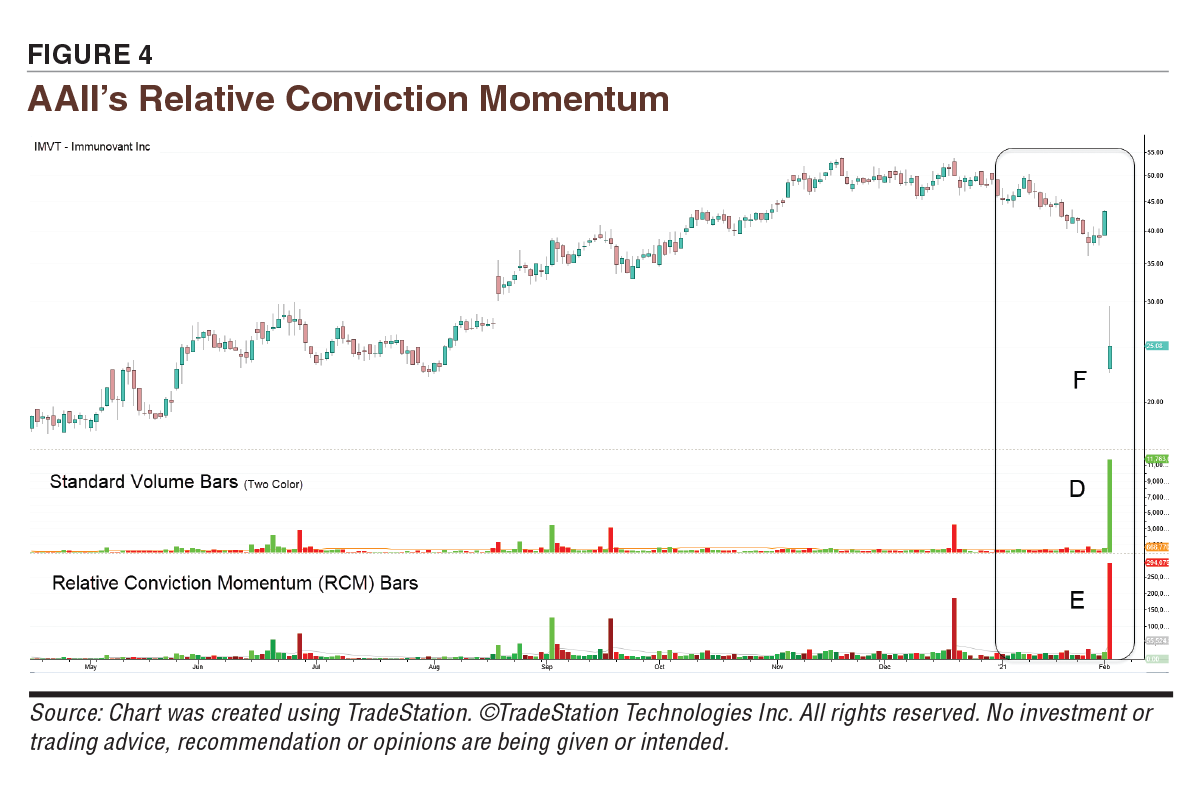
Figure 4 shows two more areas where AAII’s Relative Conviction Momentum (RCM) indicator can give an investor an advantage. Standard volume bars are shown in the middle pane, and the RCM indicator is shown in the bottom pane.
As previously discussed and displayed in the middle pane, standard volume bars use one of two colors. When there are two colors, green is displayed if the bar finishes up from the open. Red is displayed if the bar finishes down from the open. As seen in the bottom pane, RCM not only displays if the security finishes up or down but adjusts the intensity of the color to reflect the magnitude of the price move. Brighter green colors highlight larger relative upward price moves and brighter red colors highlight larger relative down moves. This makes it much easier to identify important price moves like blowoffs (high volume/large upward price move) and selling climaxes (high volume/large down price move).
Additionally, you can see that at point D the volume bar is colored green and at point E the bar is colored red. Here RCM is displaying the return direction of where a stock finished from the previous day’s close as opposed to its open. The information from the open is already reflected in the price candle color. If a stock is reported to finish up as measured from the previous day’s close, why would we want volume colored red? Overnight price moves and gaps account for a large portion of a stock’s movements in today’s market environment.
Illustrating this at point F, we can see that the stock dropped 42% from the previous day’s close, but because it finished higher than its opening price, it was coded as green. This is not an isolated issue. In fact, many of the most commonly used volume-based indicators like On Balance Volume (OBV) and Chaikin’s Accumulation Distribution have similar calculation oddities.
Dollar volume displays the estimated amount of dollar activity. Dollar volume for a single day is calculated by multiplying the closing price by the number of shares traded. If a stock closed at $10 and traded one million shares, its dollar volume would be $10 million.
Here’s the math:
= $10 closing price × 1,000,000 shares traded
= $10,000,000 in dollar volume
Volume can be a valuable measurement and when used properly it can assist investors in evaluating a price move’s relevancy, trend strength and probable direction. Unfortunately, many of the popular volume-based methods and indicators were developed before computers were widely available and they were designed for simplicity and in a completely different market environment. One potential adaptation for these market changes is by measuring conviction, displaying it with a more diverse set of tools and by adjusting the calculation methods of some of the older volume-based indicators to make them more appropriate for today’s investor.
In future articles, I will explore these relationships in more detail, along with some of AAII’s newer conviction-based indicators. AAII conviction tools—RCM, Optimized Balance Conviction (OBC) and Kinetic Conviction (KC)—will soon be accessible on MetaStock.
AAII Community
Trading Strategies


JOHN L from NJ posted over 3 years ago:
BARRY J from TX posted over 3 years ago:
BARRY J from TX posted over 3 years ago:
DAVE G from TX posted over 3 years ago:
You need to log in as a registered AAII user before commenting.
Log InCreate an account