


Since 1934, the works of Benjamin Graham have helped to guide individual and professional investors in their quest to make good investment decisions.
Graham’s intrinsic value approach grew out of the lessons learned from the stock market crash of 1929. Rather than trying to beat the market by seeking the best companies in the hottest industries, Graham argued that it is safer to build a portfolio of undervalued stocks that are being ignored or discriminated against by the market. Graham’s approach focused on the concept of an intrinsic value that is justified by a firm’s assets, earnings, dividends and financial strength.
Graham’s philosophy continues to flourish through two primary books: “Security Analysis,” co-authored with David Dodd, and “The Intelligent Investor.”
“Security Analysis” was first released as a college investing textbook back in 1934 and was most recently revised in 2023 (seventh edition, McGraw-Hill).
“The Intelligent Investor” was first released in 1949 and is geared toward the individual investor. Graham periodically updated the book until his death in 1976. “The Intelligent Investor” has been revised since, with updates by Warren Buffett and Jason Zweig, most recently in 2006 (revised edition, Harper Business). The book presents Graham’s basic philosophy of holding a mix of bonds and stocks and selecting stocks for both the “defensive investor” and the “enterprising investor.”
These two groups are distinguished not by the amount of risk they are willing to take, but rather by the amount of “intelligent effort” they are “willing and able to bring to bear on the task.” The defensive, or passive, investor is one who does not have or is not willing to spend a great deal of time analyzing or tracking individual stocks. For the defensive investor, Graham recommends purchasing shares of important companies that have histories of long-term profitability and strong financial positions.
In contrast, the enterprising investor has greater market experience, the mental wherewithal to embark upon investing as a quasi-business, as well as additional time to devote to portfolio management. Enterprising investors, Graham felt, could expand their universe substantially, but purchases should be attractively priced as established by intelligent analysis.
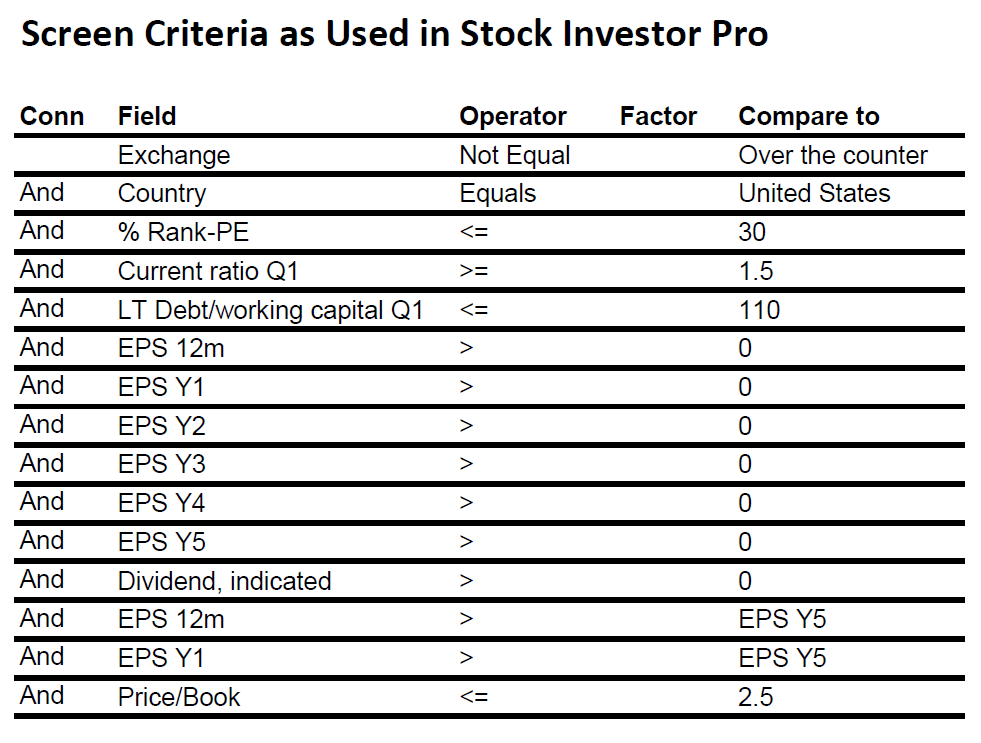
We developed a series of stock screening filters based on Graham’s investing philosophy in Stock Investor Pro, AAII’s fundamental stock screening and research database program, and we have been tracking the performance of these strategies on AAII.com.
Adjusted Graham Enterprising Stock Selection Criteria
- The price-earnings ratio is among the lowest 30% of the database (percent rank less than or equal to 30)
- Earnings per share for each of the last five fiscal years and for the last 12 months have been positive
- Earnings per share for the last 12 months are greater than earnings per share from five years ago (Y5)
- Earnings per share for the last fiscal year (Y1) are greater than earnings per share from five years ago (Y5)
- The company is paying a dividend (indicated dividend is greater than zero)
- The current ratio for the last fiscal quarter is greater than or equal to 1.5
- The ratio of long-term debt to working capital for the last fiscal quarter (Q1) is less than 110%
- The company is domestic and exchange-listed
- Adjust the price-to-book-value ratio so that only the 25 companies with lowest ratios pass the screen
Our interpretations of the approaches have performed well. However, the enterprising screening approach has suffered from a small list of passing stocks. Ten years ago, we modified our original Graham Enterprising Investor screen to better match the dynamics of the market, allowing more companies to pass the filter, yet the filter has still proven to be too restrictive at times.
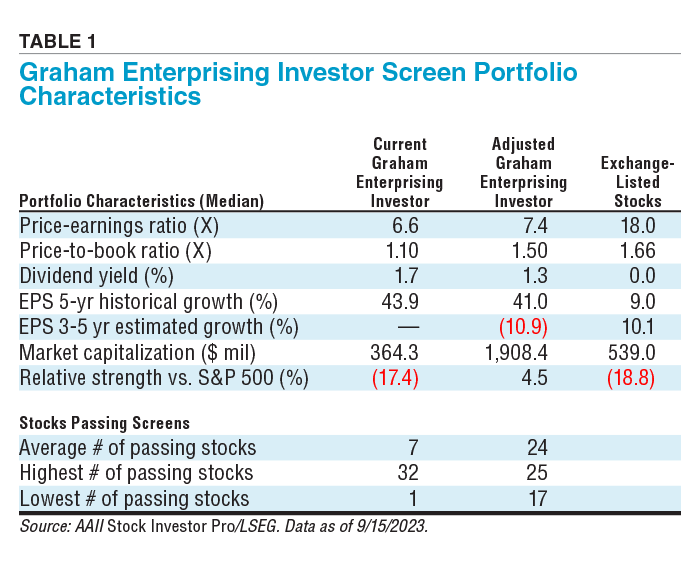
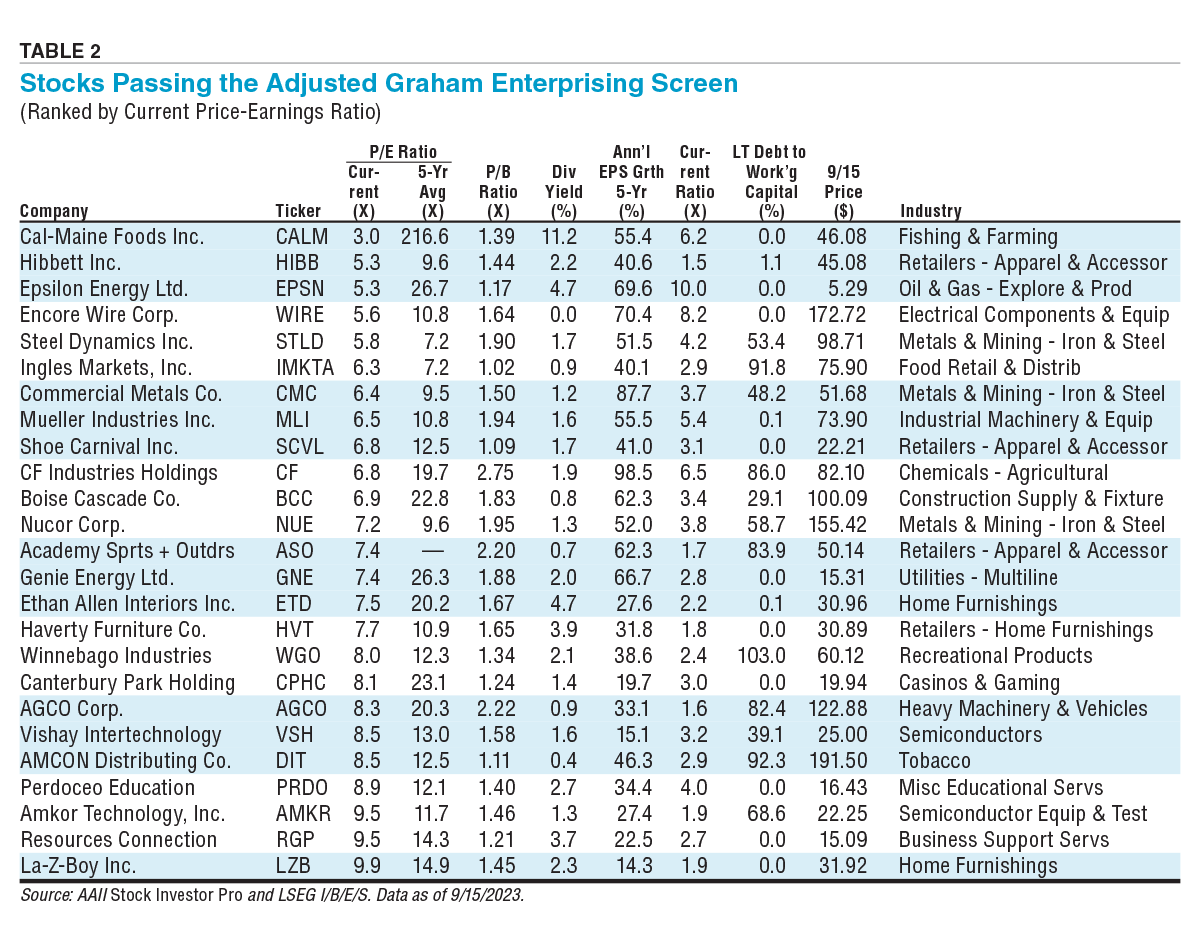
Consider these statistics: Over the last 25 years, the average number of passing companies at year end is seven with a maximum of 32 (December 2012) and a minimum of one (December 2016 and 2021). Graham recommended that investors build a diversified portfolio with a minimum of 10 stocks. For this article, we again reviewed the criteria used in AAII’s Stock Investor Pro to see if we could create a more investable strategy using Graham’s enterprising investing philosophy. The characteristics of the companies passing the current screen and the adjusted screen are presented in Table 1, while the companies passing the adjusted Graham Enterprising Investor screen are presented in in Table 2 in ascending order by current price-earnings (P/E) ratio.
Download Excel file of Table 2 here.
The Enterprising Investor Screen
Graham had a number of recommendations for how the enterprising investor could hope to profit in the market. Graham’s last revision of the “The Intelligent Investor” was written in late 1971 through early 1972, just before the personal computer facilitated stock screening for the individual investor. Graham used the S&P Stock Guide to illustrate how an investor could perform a manual screen with the monthly booklet that provided basic fundamental data on around 4,500 stocks. Part of the simplicity of Graham’s Enterprising Investor screen stems from the limited dataset in the S&P Stock Guide and revolves around how an investor can page through the guide to find a list of candidates.
Price-Earnings Ratio
The primary valuation filter employed by Graham’s Enterprising Investor screen involves the price-earnings ratio—share price divided by earnings per share. Graham felt that one of the keys to selecting stocks is to purchase them at a significant discount. Graham’s first screen for the enterprising investor was to look for companies trading with price-earnings ratios below nine or 10 times trailing earnings. As Graham thumbed through the S&P Stock Guide, he thought about one in 10 stocks would pass such a filter in late 1971. We took this cue to establish a filter that required a company’s price-earnings ratio to be among the lowest 10% of all stocks.
Our preference was to keep the filter as a percentage rank, which automatically adjusts the actual maximum as market valuation fluctuates. One thing to note is that to calculate a valid price-earnings ratio, a company must have positive trailing earnings, so during times of economic distress, a greater proportion of companies will not have meaningful ratios. In the current market environment, price-earnings ratios that appear among the lowest 10% of valid ratios are lowest than 6.0.
Ten years ago, we made a simple adjustment to allow companies with price-earnings ratios in the lowest 25% of stocks to pass the Graham Enterprising Investor screen. Today, that translates to a price-earnings ratio of less than 8.8. To widen our pool for the current market level, we further loosened the screen to require a price-earnings ratio in the lowest 30% of stocks, which translates to a price-earnings ratio of 10.0 or below. The stocks passing the current screen have a median price-earnings ratio of 6.6, while the adjusted screen has a median of 7.4. Both are well below the median value of 18.0 for all exchanged-listed stocks. The table of passing companies presents both the current price-earnings ratio and the five-year average for comparison.
Financial Condition
As a test of short-term liquidity, Graham specified a current ratio (current assets divided by current liabilities) of 1.5 or higher.
To measure the use of long-term debt, Graham required that long-term debt not exceed net current assets, or working capital, by 110%. Working capital is defined as current assets minus current liabilities.
Earnings Stability
Graham liked to look at the historical company performance over an extended period of time. He had a preference for companies that avoided losses during recessionary periods. For the enterprising investor, Graham specified that earnings should be positive for each of the last five years. This type of screen can be very restrictive during and after an economic recession. It is a key component to establishing strong companies, so we left it unchanged.
Dividend Record
For the enterprising investor, Graham only specified that firms pay some level of dividends—a simple filter that screens out 70% of the firms in Stock Investor Pro
as a stand-alone criterion. Generally, only more mature companies past their stage of strong, capital-intensive growth can afford to pay a cash dividend.
Earnings Growth
When it came to earnings growth, Graham required only that earnings for the latest year be higher than earnings five years ago. Without such a criterion, a screen looking for companies with low multiples may list companies with poor prospects. This is not the domain of the enterprising investor. The combination of positive earnings and higher earnings results in a list of passing companies with very high historical earnings growth rates.
Adequate Size of Enterprise
Graham had a preference for large companies. He felt that large firms have the resources in “capital and brain power” to carry them through adversity and back to a level of satisfactory earnings. This concern came into play for Graham because he looked at stocks of firms that became unpopular due to unsatisfactory developments that were of a temporary nature. Graham also felt that the market responds more quickly with a price increase when an improvement is shown in a large firm rather than a small firm.
The enterprising investor could invest in “speculative” issues such as small stocks, so Graham had no requirements for minimum company size. We did, however, add a requirement that a company be listed on an exchange, and we are excluding foreign companies. The current Graham Enterprising Investor screen tended to have small-cap companies pass the filter. The market capitalization of the adjusted screen is more varied and has a greater median market cap of $1.9 billion.
Price-to-Book-Value Ratio
Graham was a believer in using low price-to-book-value (P/B) ratios to select stocks, and he normally required a ratio below 1.5 for the defensive investor. Our original Graham enterprising screen specified a maximum price-to-book-value level of 1.20. Since we already have the price-earnings ratio as a primary valuation ratio, we felt that it would be interesting to adjust the price-to-book ratio so that a reasonable number of companies would pass the screen. We settled on adjusting the price-to-book filter so that 25 companies would pass the adjusted Graham Enterprising Investor screen. The median price-to-book ratio of the companies passing the original screen is 1.10 compared to 1.50 for the adjusted screen. Both are below the 1.66 median value for all exchange-listed stocks.
Graham was a strong believer in using a portfolio to protect against errors in judgment. For that reason, he placed a heavy emphasis on diversification. Graham stressed the need for a broadly diversified portfolio: a minimum of 15 holdings for the enterprising investor, but preferably a larger group consisting of about 30 of the best prospects selling at significant discounts from their intrinsic value.
Stock holdings should be reviewed at least annually, he said, paying attention to dividend returns and the operating results of the company and ignoring share price fluctuations. However, if the holdings were originally properly valued, he felt there would be little need for changes.
Performance
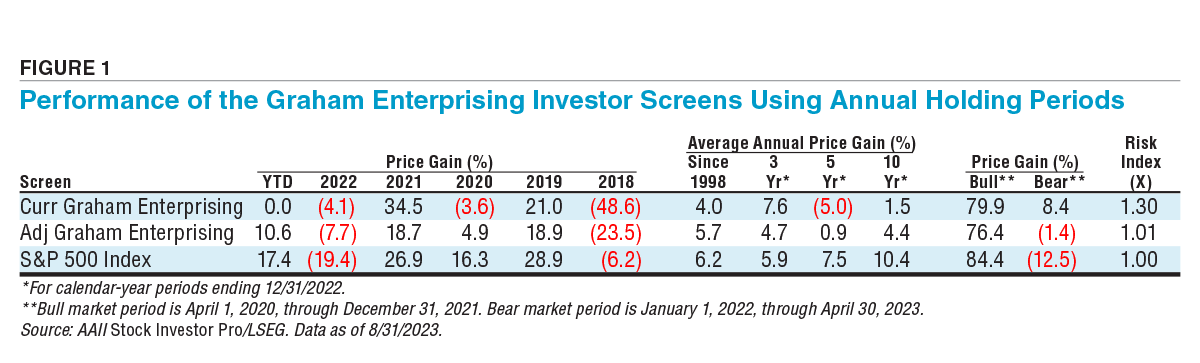
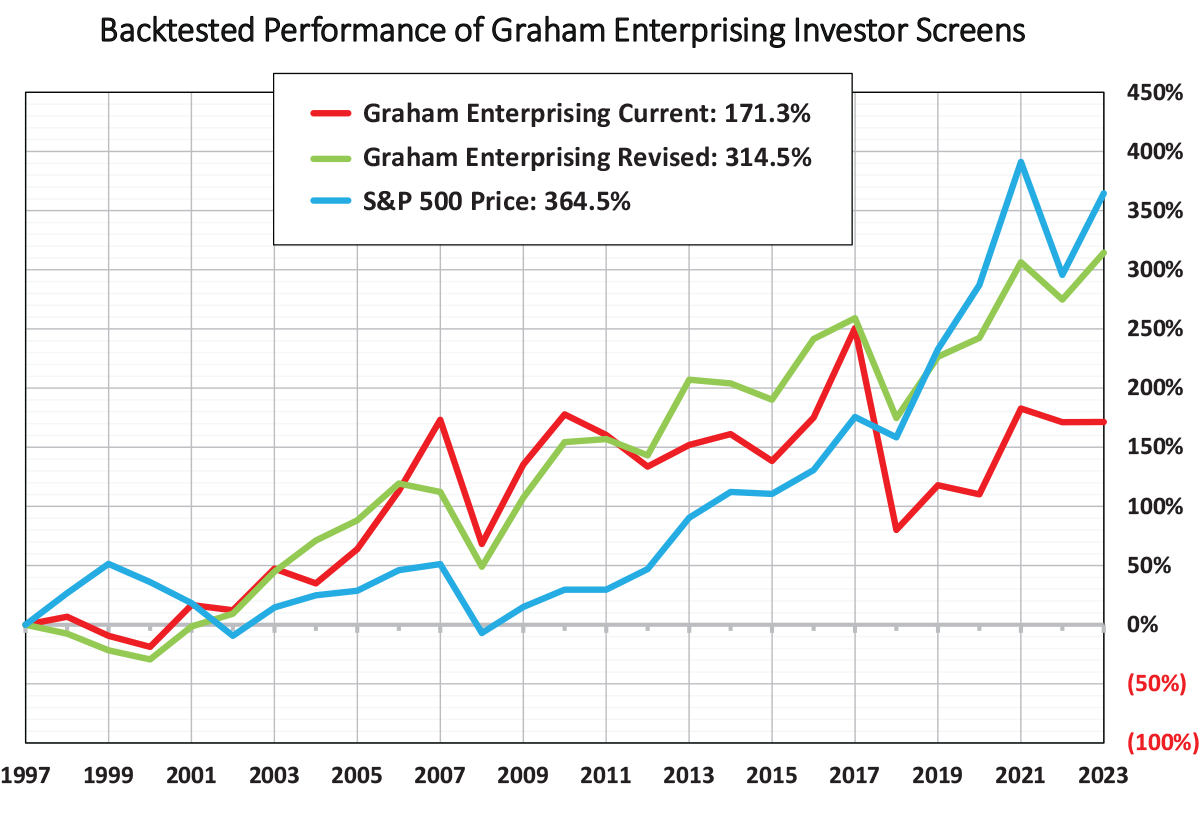
Figure 1 shows selected performance and risk statistics for AAII’s current Graham Enterprising Investor screen, which was revised in 2012, and our new adjusted screen, which loosened the price-earnings rank to 30% and adjusted the price-to-book ratio so that 25 companies would pass the filter. For our backtest, we ran the screen using year-end data and held the hypothetical portfolio for one year.
We found that during times of economic distress, even the loosened screen could not come up with 25 passing companies, but that was much better than the single-digit number of passing companies for the current Graham Enterprising Investor screen. The adjusted Graham enterprising screen averaged 24 passing companies compared to seven for the current screen. The lowest number of passing companies was 17 compared to a low of one for the current screen.
Value strategies and smaller-cap strategies have been out of favor for some time. With annual rebalancing, the compound annual growth rate (CAGR) of the new adjusted Graham Enterprising Investor screen was 5.7% since inception in 1998, better than the current Graham Enterprising Investor screen, which had a compound annual return of 4.0% since 1998. However, the price gain was lower than the S&P 500 index’s gain of 6.2% over the same period. The performance of the Graham Enterprising Investor screen was significantly lower using annual rebalancing compared to monthly rebalancing, so we will study the impact of various holding periods.
Looking at the overall risk of the screens, we see that the risk index is 1.01 for the adjusted screen, but 1.30 for the original screen. The adjusted screen has roughly the same volatility as the S&P 500, but the current enterprising screen is 30% more volatile.
Graham in Summary
Graham’s contrarian view dictates that stocks will appear most attractive when they are relatively unpopular with the market. The selection process takes great conviction and discipline because the momentum of the market will seemingly be against the investor and there may be no clear indication as to when the market will come around and agree with you. However, the possibility of extraordinary gains only exists when the investor disagrees with the market.
Definitions of Terms
Annual EPS Growth Rate—Last Five Years: Average annual growth in earnings per share over the last five fiscal years. A measure of how successful the firm has been in generating and growing the bottom line, net profit.
Current Ratio: Current assets divided by current liabilities. A measure of short-term financial liquidity of the firm. Higher ratios indicate greater liquidity, at the potential cost of a lower return on assets.
Dividend Yield: Indicated annual dividend per share divided by the price per share. An indication of the income generated by a share of stock.
Long-Term Debt to Working Capital: Long-term debt divided by working capital. Working capital is determined by subtracting current liabilities from current assets. An indication of the level of long-term liabilities relative to short-term assets, which can be used to fund long-term liabilities.
Price-Earnings Ratio—Current: Market price per share divided by the most recent 12 months’ earnings per share. A measure of expectation regarding the firm’s earnings growth potential and risk. Firms with very high price-earnings ratios are being valued by the market based on higher expected growth potential and greater certainty of growth.
Price-Earnings Ratio—Five-Year Average: An average of the high and low price-earnings ratios for the past five years. Provides a base from which to compare the current level of the price-earnings ratio. Current price-earnings ratios below the five-year average may point to an undervalued stock.
Price-to-Book-Value Ratio: Market price per share divided by book value (assets less liabilities) per share. A measure of stock valuation relative to net assets. A high ratio might imply an overvalued situation; a low ratio might indicate an overlooked stock.

Related

Stock Strategies
Uses and Misuses of Ben Graham–Style Investing
Related

AAII Stock Ideas
Adjusting the Benjamin Graham Enterprising Investor Screen
Discussion
FREE REPORT

Get your free copy of our special
report analyzing the tech stocks
most likely to outperform the
market.
BARRY J from TX posted over 3 years ago:
JEAN H from IL posted over 3 years ago:
Michael H from IL posted over 2 years ago:
BARRY J from TX posted over 2 years ago:
TYLER M from CA posted over 2 years ago:
JOHN L from NJ posted over 2 years ago:
JAMES L from TN posted over 2 years ago:
You need to log in as a registered AAII user before commenting.
Log InCreate an account