


Trade-Radar Stock Inspector is a program designed to help investors analyze data on stocks, mutual funds, exchange-traded funds (ETFs), indexes and other important elements in an investor’s portfolio. To begin your analysis, click File, then “data import.” Users have the option to load data directly from Yahoo! Finance. Users get to pick the data range. If you wish to download more than one stock’s information at once, you can create a “batch file” on your computer to store the data.
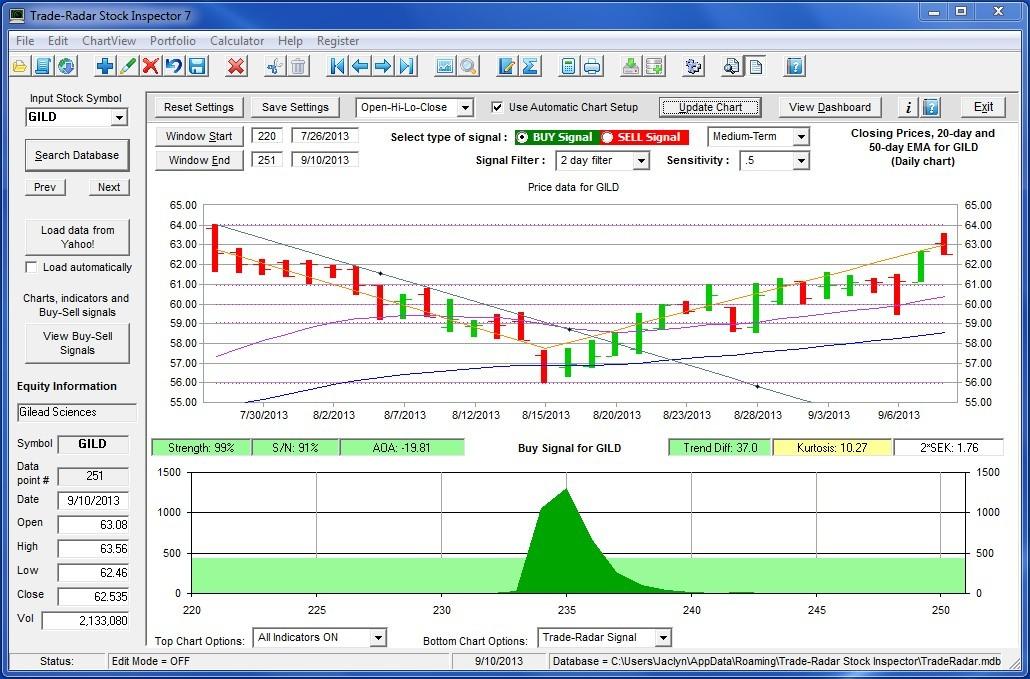
If you download one stock’s information, a chart will pop up on the main screen. Users can choose how much data is displayed on the chart. If you don’t have specific points of time in mind, Trade-Radar has predefined intervals: short-term, medium-term, and long-term. Underneath the price data chart is a buy-sell signal chart. The system identifies reversals in price movements, and investors then have to figure out whether the reversal is significant enough to enter into a trade with confidence. Users can choose different charts or indicators to display with drop-down menus.
The Dashboard screen can be accessed by a button on the buy/sell screen. The Dashboard provides users with a quick view of the signal indicators using a color-coded system to determine quality. The color-coded system uses red, yellow and green, with green marking the best quality and red the worst, and each indicator is accompanied with a brief description. Users have access to other standard technical analysis calculations, including figures on trend analysis, buying/selling pressure, momentum and moving averages. The Fundamental Analysis tab on the Dashboard provides, naturally, fundamental analysis of any given security. Again using the color-coding system, Trade-Radar will give a security a green light if the company is performing well financially and offers good valuation at its current price level. Yellow or red lights indicate that a company is either overvalued or performing poorly. These are just indicators, however; users must make their own decisions on whether a security is worth purchasing based on the information provided.
The Portfolio screen lets users track trade information. You can capture the signal indicators at the time the trade was entered and closed, along with other calculations. This way, users have a record of the exact circumstances surrounding their trade.
The Stock Inspector can create portfolio reports based on a watch list. Securities are displayed in a spreadsheet format, and color-coded based on whether they confirm a specific type of trade signal (buy, sell or hold). Using this feature lets investors see if a security might have changed from sell to buy (or vice versa) so they can consider possible entry and exit points.
Overall, Trade-Radar Stock Inspector is a useful product for analyzing buy and sell points as well as viewing indicators. If you have any issues, Trade-Radar has a Help feature that will answer many of your questions. There is a 45-day trial, after which you can decide whether this program is useful enough for you to purchase. There are two versions of the program, Standard and Pro. The Pro version has added automation to help you download data, generate signals and create reports of buy/sell signals without manual intervention.
Trade-Radar Stock Inspector Version 7
https://www.aaii.com/download-library/download?DL_ID=777
System Requirements: Windows NT/2000/XP/2003/Vista/7
Size: 22.44 MB
Price: Free 45-day trial, Standard version $69.99, Pro version $99.99
Discussion
FREE REPORT

Robert Cunningham from AR posted over 13 years ago:
Edward Emory from TN posted over 13 years ago:
Jaclyn from IL posted over 12 years ago:
You need to log in as a registered AAII user before commenting.
Log InCreate an account